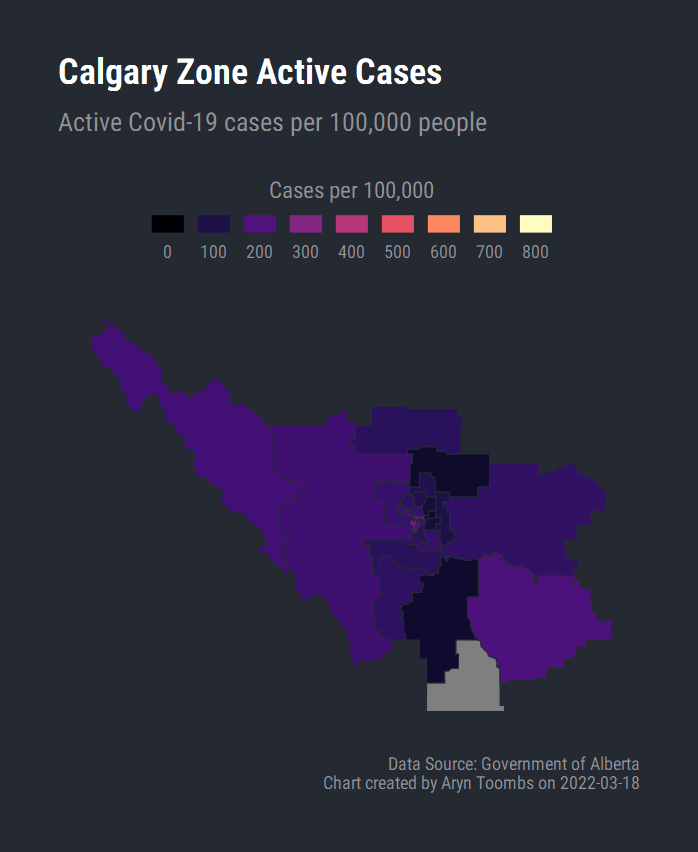
Regional Cases: Calgary Zone
| Calgary Zone Active Covid-19 Cases | |||||
|---|---|---|---|---|---|
| Active per 100k rate and active cases, updated on 2022-03-17 | |||||
| Date | Region | Active per 100k | Change to Active per 100k | Active Cases | Change to Active Cases |
| 2022-03-17 | Claresholm (Central Willow Creek Md) | 800.5 | 96.1 | 50 | 6 |
| 2022-03-17 | Calgary - Centre West | 256.7 | 10.7 | 169 | 7 |
| 2022-03-17 | Calgary - Centre North | 244.9 | 11.1 | 110 | 5 |
| 2022-03-17 | Calgary - Elbow (& Nearby Neighbourhoods) | 215.5 | 14.7 | 88 | 6 |
| 2022-03-17 | Calgary - West Bow (& Nearby Neighbourhoods) | 191.9 | 4.7 | 41 | 1 |
| 2022-03-17 | Vulcan (Vulcan County) | 191.9 | 29.5 | 13 | 2 |
| 2022-03-17 | Banff | 171.0 | 14.9 | 23 | 2 |
| 2022-03-17 | Canmore (Kananaskis - Bighorn Md - Stoney - West Rocky View County) | 166.2 | 28.9 | 46 | 8 |
| 2022-03-17 | Calgary - Centre | 165.8 | 10.4 | 112 | 7 |
| 2022-03-17 | Calgary - Lower Nw | 161.1 | 23.9 | 101 | 15 |
| 2022-03-17 | Calgary - West | 159.2 | 0.0 | 147 | 0 |
| 2022-03-17 | Calgary - Se | 151.8 | -2.9 | 204 | -4 |
| 2022-03-17 | Cochrane - Springbank (Nearby Rocky View County) | 151.5 | 1.9 | 77 | 1 |
| 2022-03-17 | Calgary - Nose Hill (& Nearby Neighbourhoods) | 147.4 | 1.3 | 115 | 1 |
| 2022-03-17 | Strathmore (Siksika, East Rocky View County & Wheatland County) | 139.9 | 19.6 | 50 | 7 |
| 2022-03-17 | Calgary - Sw | 139.4 | -0.8 | 163 | -1 |
| 2022-03-17 | Black Diamond (Turner Valley & West Foothills Md) | 136.8 | 11.4 | 12 | 1 |
| 2022-03-17 | Calgary - Upper Nw | 131.0 | 12.2 | 162 | 15 |
| 2022-03-17 | Okotoks-Priddis (North Foothills Md) | 128.1 | 8.6 | 59 | 4 |
| 2022-03-17 | Didsbury (Carstairs & South Mountain View County) | 127.5 | 24.3 | 21 | 4 |
| 2022-03-17 | Calgary - Fish Creek (& Nearby Neighbourhoods) | 127.3 | 2.7 | 142 | 3 |
| 2022-03-17 | Airdrie | 111.3 | 9.5 | 82 | 7 |
| 2022-03-17 | Calgary - North | 107.8 | -5.2 | 126 | -6 |
| 2022-03-17 | Chestermere (Nearby Rocky View County) | 104.2 | -4.0 | 26 | -1 |
| 2022-03-17 | Calgary - East | 84.1 | 4.1 | 61 | 3 |
| 2022-03-17 | Calgary - Upper Ne | 81.0 | -1.6 | 98 | -2 |
| 2022-03-17 | High River (South Foothills Md & North Willow Creek Md) | 67.4 | 8.4 | 16 | 2 |
| 2022-03-17 | Crossfield (Nearby Rocky View County) | 65.5 | -21.8 | 6 | -2 |
| 2022-03-17 | Calgary - Lower Ne | 65.3 | -2.1 | 63 | -2 |
| Data Source: Government of Alberta Change from last set of data on 2022-03-16 |
|||||
Regional Cases: Edmonton Zone
| Edmonton Zone Active Covid-19 Cases | |||||
|---|---|---|---|---|---|
| Active per 100k rate and active cases, updated on 2022-03-17 | |||||
| Date | Region | Active per 100k | Change to Active per 100k | Active Cases | Change to Active Cases |
| 2022-03-17 | Sturgeon County West | 268.6 | -26.5 | 81 | -8 |
| 2022-03-17 | Thorsby (West Leduc County) | 253.0 | -22.0 | 23 | -2 |
| 2022-03-17 | Leduc & Devon | 220.8 | -7.0 | 95 | -3 |
| 2022-03-17 | Sherwood Park | 211.0 | 9.7 | 173 | 8 |
| 2022-03-17 | Edmonton - Twin Brooks (& Nearby Neighbourhoods) | 193.5 | 5.3 | 147 | 4 |
| 2022-03-17 | Edmonton - West Jasper Place (& Nearby Neighbourhoods) | 161.4 | 4.8 | 167 | 5 |
| 2022-03-17 | St. Albert | 145.1 | 8.6 | 101 | 6 |
| 2022-03-17 | Strathcona County Excluding Sherwood Park | 143.0 | -5.8 | 25 | -1 |
| 2022-03-17 | Edmonton - Woodcroft East (& Nearby Neighbourhoods) | 141.7 | 3.3 | 86 | 2 |
| 2022-03-17 | Edmonton - Bonnie Doon (& Nearby Neighbourhoods) | 136.6 | 2.1 | 132 | 2 |
| 2022-03-17 | Sturgeon County East | 131.2 | 0.0 | 8 | 0 |
| 2022-03-17 | Edmonton - Northgate (& Nearby Neighbourhoods) | 122.9 | -9.7 | 102 | -8 |
| 2022-03-17 | Edmonton - Duggan (& Nearby Neighbourhoods) | 122.1 | 0.0 | 49 | 0 |
| 2022-03-17 | Edmonton - Rutherford (& Nearby Neighbourhoods) | 120.3 | -2.6 | 135 | -3 |
| 2022-03-17 | Edmonton - Eastwood (& Nearby Neighbourhoods) | 116.5 | 1.4 | 84 | 1 |
| 2022-03-17 | Edmonton - Castle Downs (& Nearby Neighbourhoods) | 114.5 | -2.8 | 82 | -2 |
| 2022-03-17 | Stony Plain & Spruce Grove | 113.8 | -6.9 | 66 | -4 |
| 2022-03-17 | Westview Excluding Stony Plain & Spruce Grove | 112.1 | -10.9 | 41 | -4 |
| 2022-03-17 | Edmonton - Jasper Place (& Nearby Neighbourhoods) | 110.8 | 0.0 | 52 | 0 |
| 2022-03-17 | Edmonton - Woodcroft West (& Nearby Neighbourhoods) | 109.1 | 6.1 | 36 | 2 |
| 2022-03-17 | Edmonton - Mill Woods South & East | 99.7 | 0.0 | 85 | 0 |
| 2022-03-17 | Edmonton - Ne | 98.1 | -4.4 | 89 | -4 |
| 2022-03-17 | Edmonton - Mill Woods West | 86.0 | 1.9 | 44 | 1 |
| 2022-03-17 | Fort Saskatchewan | 82.1 | -11.2 | 22 | -3 |
| 2022-03-17 | Beaumont (East Leduc County) | 73.7 | 0.0 | 19 | 0 |
| 2022-03-17 | Edmonton - Abbottsfield (& Nearby Neighbourhoods) | 68.6 | 0.0 | 10 | 0 |
| Data Source: Government of Alberta | |||||
Regional Cases: North Zone

| North Zone Active Covid-19 Cases | |||||
|---|---|---|---|---|---|
| Active per 100k rate and active cases, updated on 2022-03-17 | |||||
| Date | Region | Active per 100k | Change to Active per 100k | Active Cases | Change to Active Cases |
| 2022-03-17 | St. Paul (Saddle Lake And Surrounding St. Paul County) | 444.5 | 32.2 | 69 | 5 |
| 2022-03-17 | High Prairie (Nearby Big Lakes County & Se Northern Sunrise County) | 430.5 | 8.6 | 50 | 1 |
| 2022-03-17 | Smoky Lake (Nearby Smoky Lake County & West Thorhild County) | 359.6 | 0.0 | 17 | 0 |
| 2022-03-17 | Boyle (Se Athabasca County) | 338.6 | 0.0 | 12 | 0 |
| 2022-03-17 | Bonnyville (Nearby Bonnyville Md) | 307.2 | -24.1 | 51 | -4 |
| 2022-03-17 | Spirit River (Saddle Hills County, Spirit River Md & Birch Hills County) | 294.4 | -16.4 | 18 | -1 |
| 2022-03-17 | Falher (Smoky River Md) | 293.7 | 0.0 | 13 | 0 |
| 2022-03-17 | Wood Buffalo | 270.8 | -196.9 | 11 | -8 |
| 2022-03-17 | Peace River (Peace Md, Northern Sunrise County & Sw Northern Lights County) | 252.5 | 21.5 | 47 | 4 |
| 2022-03-17 | Mayerthorpe (Lac Ste. Anne County) | 240.7 | 30.8 | 39 | 5 |
| 2022-03-17 | Grande Cache (Sw Greenview Md) | 239.9 | -24.0 | 10 | -1 |
| 2022-03-17 | Frog Lake (West St. Paul County & South Bonnyville Md) | 227.9 | 0.0 | 11 | 0 |
| 2022-03-17 | Wabasca (Nearby Opportunity Md) | 212.3 | 23.5 | 9 | 1 |
| 2022-03-17 | Fairview (Fairview Md & South Clear Hills Md) | 184.5 | 0.0 | 15 | 0 |
| 2022-03-17 | Beaverlodge (West Grande Prairie County) | 139.4 | -16.4 | 17 | -2 |
| 2022-03-17 | Slave Lake (Nearby Lesser Slave County & Sw Opportunity Md) | 137.0 | -8.6 | 16 | -1 |
| 2022-03-17 | Cold Lake (East Bonnyville Md) | 130.3 | 4.8 | 27 | 1 |
| 2022-03-17 | Westlock (Westlock County, West Thorhild County, South Lesser Slave River) | 120.0 | -10.4 | 23 | -2 |
| 2022-03-17 | Barrhead (Barrhead County & Nw Woodlands County) | 109.6 | 9.1 | 12 | 1 |
| 2022-03-17 | Jasper | 107.3 | 0.0 | 6 | 0 |
| 2022-03-17 | Grande Prairie County (Central And East Portions) | 100.7 | -9.5 | 21 | -2 |
| 2022-03-17 | Edson (Central Yellowhead County) | 99.7 | 6.2 | 16 | 1 |
| 2022-03-17 | Lac La Biche (Lac La Biche County, Nw Smoky Lake County & Id 349) | 96.2 | -9.6 | 10 | -1 |
| 2022-03-17 | High Level (Mackenzie County & Nw Wood Buffalo) | 91.7 | -8.0 | 23 | -2 |
| 2022-03-17 | Fox Creek (Se Greenview Md) | 89.3 | 89.3 | 2 | 2 |
| 2022-03-17 | City Of Grande Prairie | 88.9 | 0.0 | 66 | 0 |
| 2022-03-17 | Athabasca (Nearby Athabasca County, South Opportunity Md & East Lesser Slave Lake Md) | 84.2 | 0.0 | 9 | 0 |
| 2022-03-17 | Hinton (West Yellowhead County) | 81.6 | 8.2 | 10 | 1 |
| 2022-03-17 | Whitecourt (Sw Woodlands County) | 81.5 | -13.6 | 12 | -2 |
| 2022-03-17 | Valleyview (Ne Greenview Md) | 69.2 | -13.8 | 5 | -1 |
| 2022-03-17 | Fort Mcmurray | 60.4 | 1.2 | 48 | 1 |
| 2022-03-17 | Manning (North Northern Lights County & North Clear Hills Md) | 30.4 | 0.0 | 1 | 0 |
| 2022-03-17 | Swan Hills (South Big Lakes County) | 0.0 | 0.0 | 0 | 0 |
| Data Source: Government of Alberta | |||||
Regional Cases: Central Zone
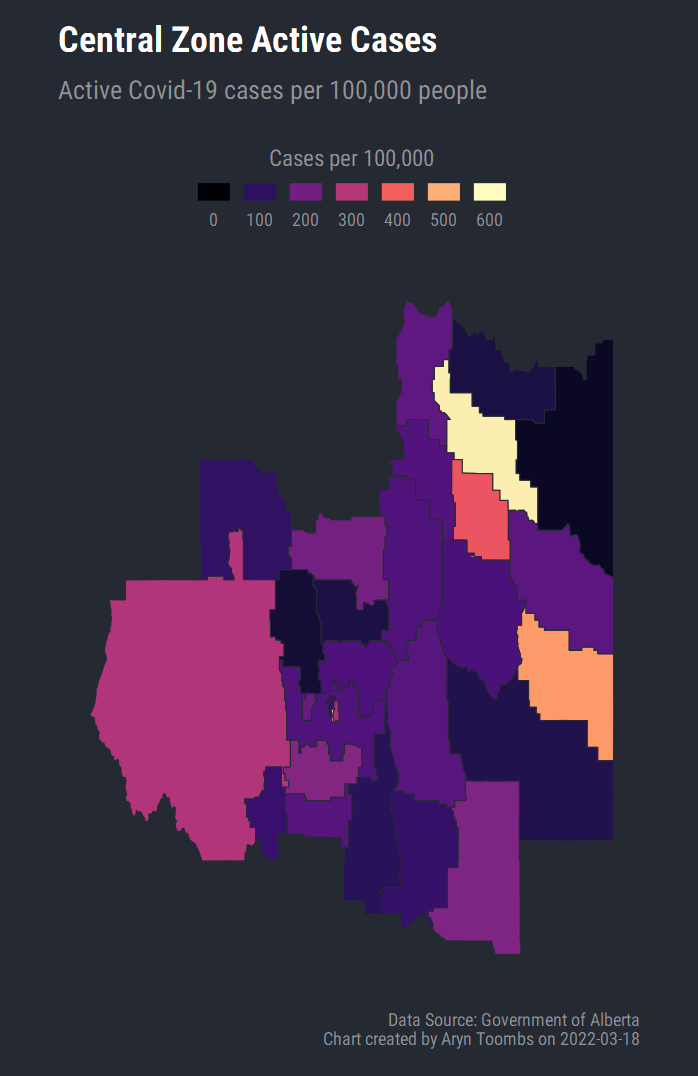
| Central Zone Active Covid-19 Cases | |||||
|---|---|---|---|---|---|
| Active per 100k rate and active cases, updated on 2022-03-17 | |||||
| Date | Region | Active per 100k | Change to Active per 100k | Active Cases | Change to Active Cases |
| 2022-03-17 | Vegreville/Minburn County | 581.2 | -9.7 | 60 | -1 |
| 2022-03-17 | Red Deer - Sw (Gaetz Ave) | 529.4 | 0.0 | 83 | 0 |
| 2022-03-17 | Md Of Provost | 473.2 | -267.5 | 23 | -13 |
| 2022-03-17 | Viking (Beaver County East) | 382.8 | 42.6 | 9 | 1 |
| 2022-03-17 | Rocky Mountain House (Clearwater County) | 294.3 | 0.0 | 60 | 0 |
| 2022-03-17 | Red Deer - East | 271.9 | -7.3 | 150 | -4 |
| 2022-03-17 | Innisfail (South Red Deer County) | 225.8 | -12.6 | 36 | -2 |
| 2022-03-17 | Planning & Special Area 2 (North Sa 2 & Hanna) | 219.3 | 27.4 | 8 | 1 |
| 2022-03-17 | Wetaskiwin County (Maskwacis) | 201.7 | -14.8 | 68 | -5 |
| 2022-03-17 | Sylvan Lake | 183.2 | 11.1 | 33 | 2 |
| 2022-03-17 | Lamont County | 172.2 | 0.0 | 11 | 0 |
| 2022-03-17 | Md Of Wainwright | 167.9 | -25.1 | 20 | -3 |
| 2022-03-17 | Stettler & County | 159.7 | -16.0 | 20 | -2 |
| 2022-03-17 | Olds (North Mountain View County) | 158.8 | 0.0 | 20 | 0 |
| 2022-03-17 | Tofield (Beaver County West) | 153.9 | 25.6 | 12 | 2 |
| 2022-03-17 | Camrose & County | 149.4 | -9.9 | 45 | -3 |
| 2022-03-17 | Red Deer County (Central And North Rd County & Parts Of Lacombe County) | 149.2 | -10.2 | 44 | -3 |
| 2022-03-17 | Lacombe (& Nearby Lacombe County) | 145.8 | -4.2 | 34 | -1 |
| 2022-03-17 | Flagstaff County | 142.4 | -11.9 | 12 | -1 |
| 2022-03-17 | Red Deer - North | 123.5 | 0.0 | 44 | 0 |
| 2022-03-17 | Sundre (West Mountain View County) | 118.0 | 0.0 | 8 | 0 |
| 2022-03-17 | Starland County/Drumheller (& Se Kneehill County) | 110.1 | -8.5 | 13 | -1 |
| 2022-03-17 | Drayton Valley (Brazeau County & West Wetaskiwin County) | 105.1 | -11.1 | 19 | -2 |
| 2022-03-17 | Three Hills/Highway 21 | 92.5 | -18.4 | 10 | -2 |
| 2022-03-17 | Castor/Coronation/Consort (Special Area 4 & Paintearth County) | 81.2 | 32.5 | 5 | 2 |
| 2022-03-17 | Ponoka (East Ponoka County) | 72.6 | -8.1 | 9 | -1 |
| 2022-03-17 | Two Hills County | 71.7 | 17.9 | 4 | 1 |
| 2022-03-17 | Rimbey (West Ponoka County & Partial Lacombe County) | 59.9 | 0.0 | 6 | 0 |
| 2022-03-17 | Vermilion River County | 38.1 | 0.0 | 14 | 0 |
| Data Source: Government of Alberta | |||||
Regional Cases: South Zone
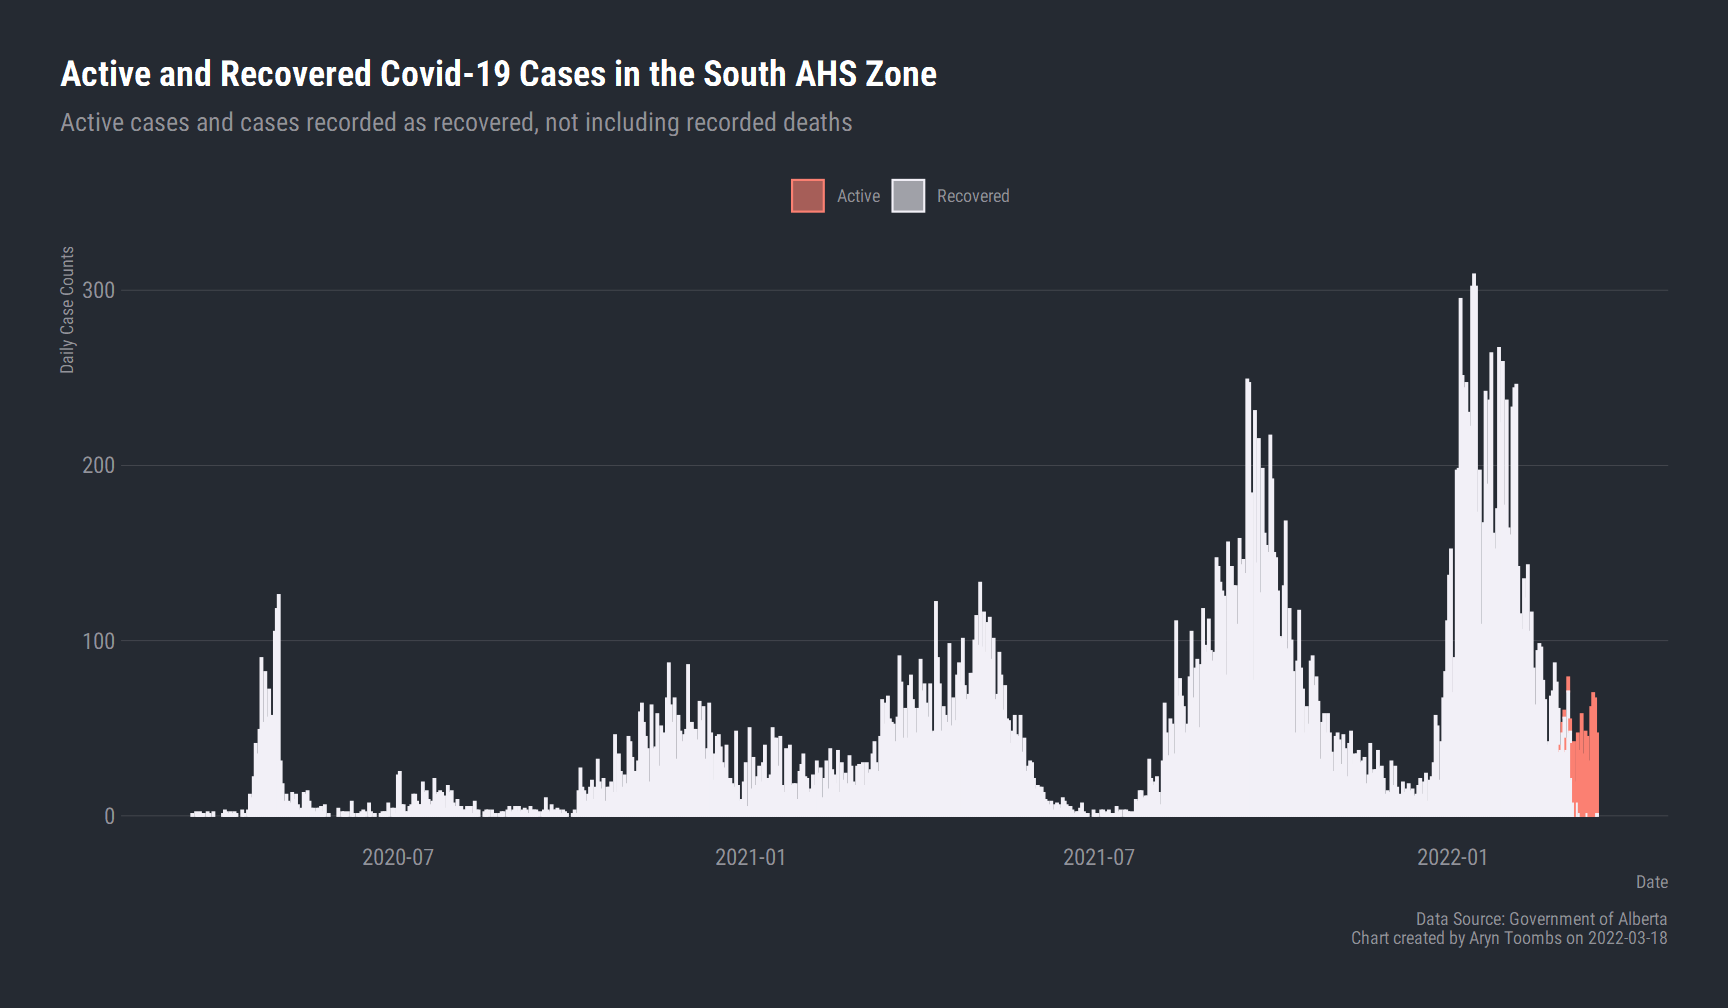
| South Zone Active Covid-19 Cases | |||||
|---|---|---|---|---|---|
| Active per 100k rate and active cases, updated on 2022-03-17 | |||||
| Date | Region | Active per 100k | Change to Active per 100k | Active Cases | Change to Active Cases |
| 2022-03-17 | Pincher Creek (Pincher Creek County And Piikani) | 371.5 | 23.9 | 31 | 2 |
| 2022-03-17 | Lethbridge - North | 350.1 | 3.6 | 98 | 1 |
| 2022-03-17 | Lethbridge - South | 282.9 | 14.5 | 97 | 5 |
| 2022-03-17 | Fort Macleod (South Willow Creek Md) | 266.6 | -29.6 | 18 | -2 |
| 2022-03-17 | Cardston-Kainai | 259.1 | -66.3 | 43 | -11 |
| 2022-03-17 | Lethbridge - West | 250.9 | -10.5 | 96 | -4 |
| 2022-03-17 | Medicine Hat | 199.4 | 8.8 | 136 | 6 |
| 2022-03-17 | County Of Lethbridge | 182.0 | -7.8 | 47 | -2 |
| 2022-03-17 | Cypress County (Redcliff) | 160.6 | 0.0 | 18 | 0 |
| 2022-03-17 | County Of Warner | 153.1 | 9.0 | 17 | 1 |
| 2022-03-17 | Taber Md | 99.9 | 0.0 | 19 | 0 |
| 2022-03-17 | Oyen (Special Area 3, Acadia Md & East Special Area 2) | 57.4 | 0.0 | 2 | 0 |
| 2022-03-17 | Newell (Brooks & South Special Area 2) | 54.0 | -3.7 | 15 | -1 |
| 2022-03-17 | Crowsnest Pass (Ranchland Md) | 47.8 | 16.0 | 3 | 1 |
| 2022-03-17 | County Of Forty Mile | 31.2 | -15.6 | 2 | -1 |
| Data Source: Government of Alberta | |||||