Current Hospitalization Charts
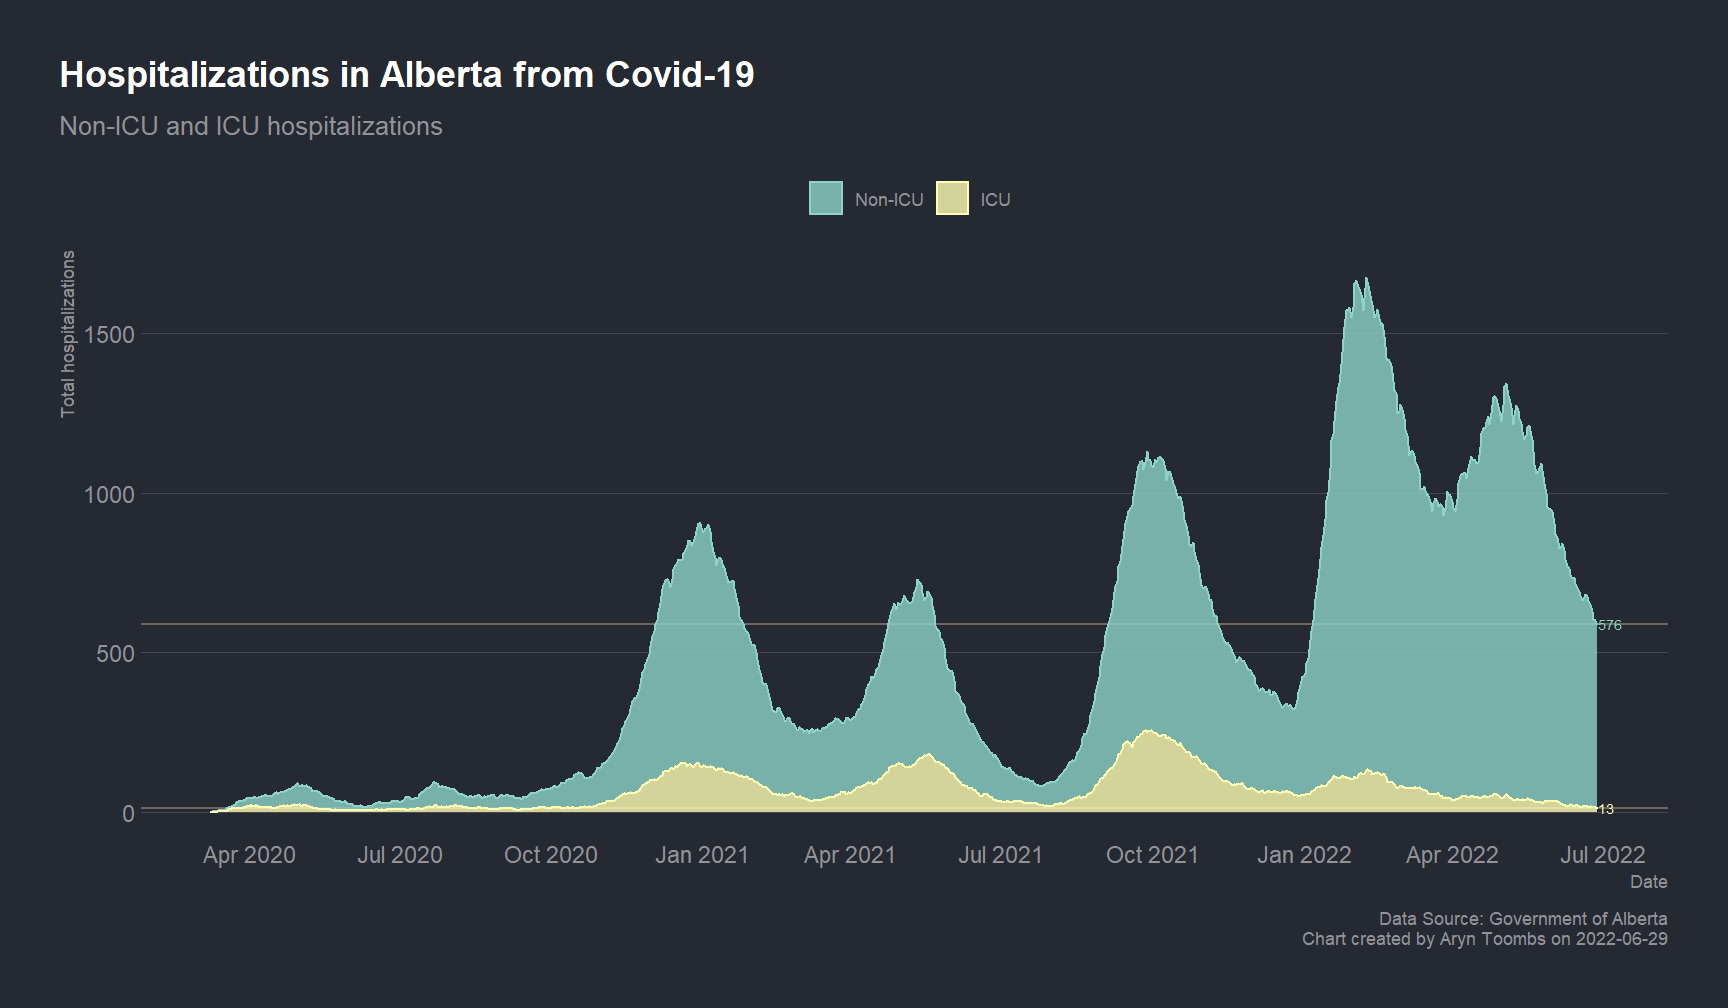
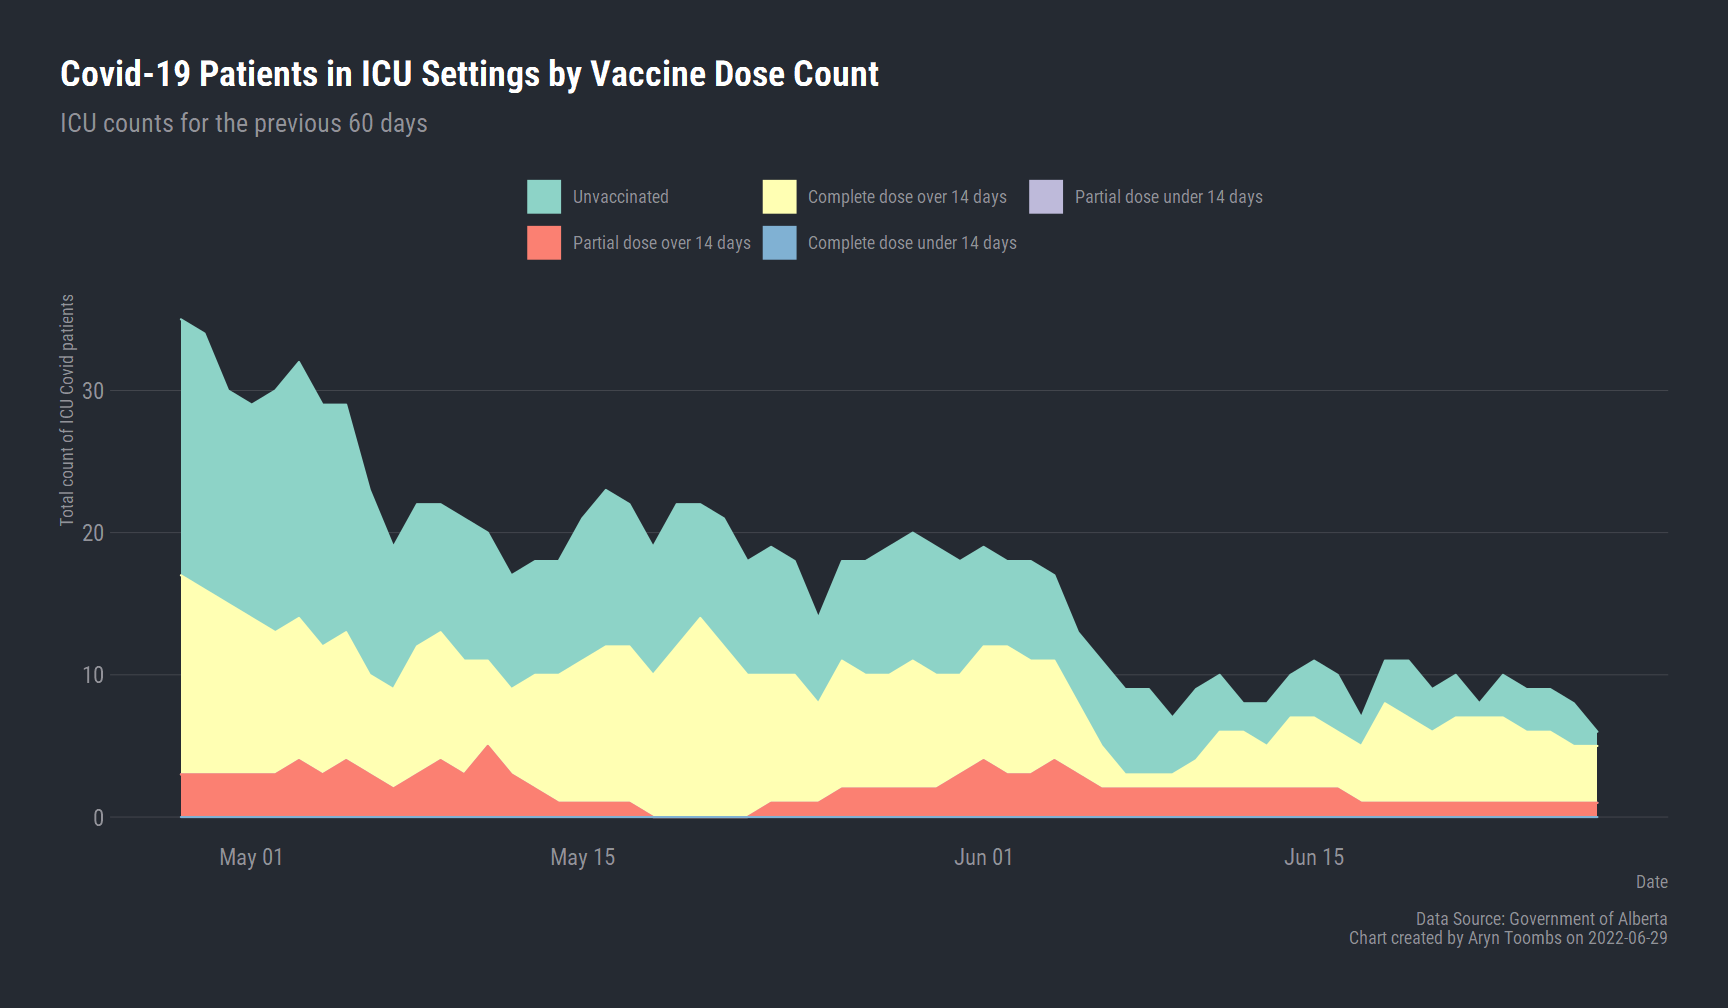
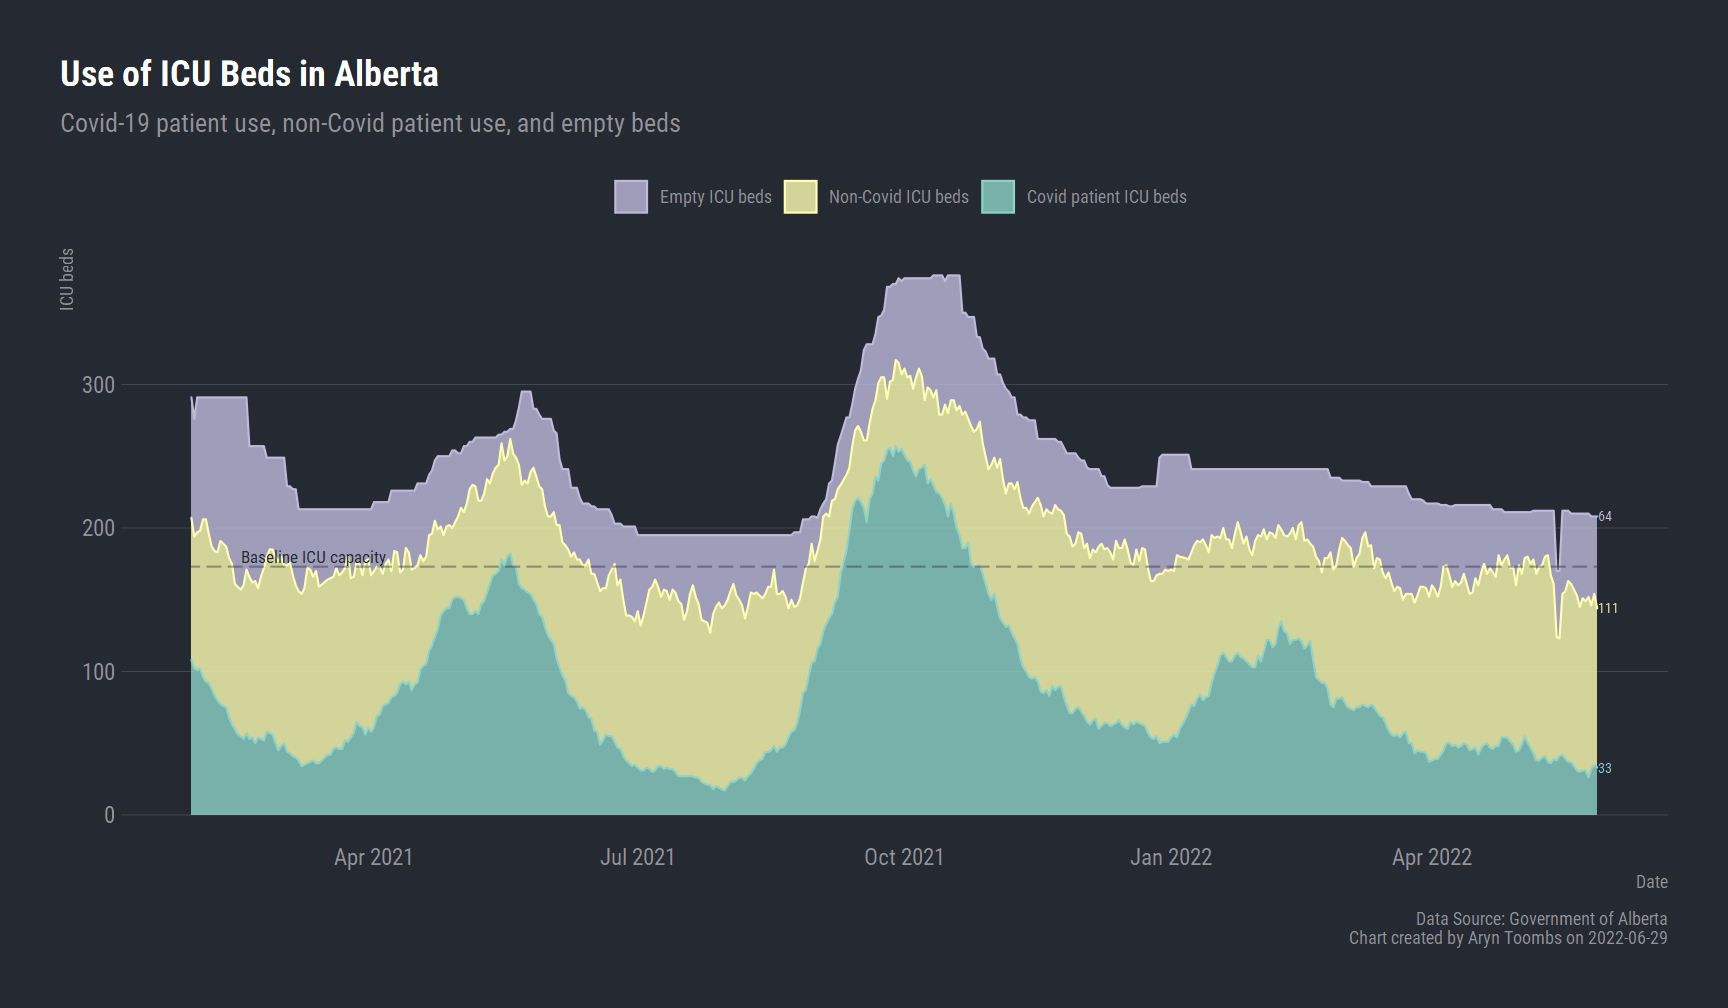
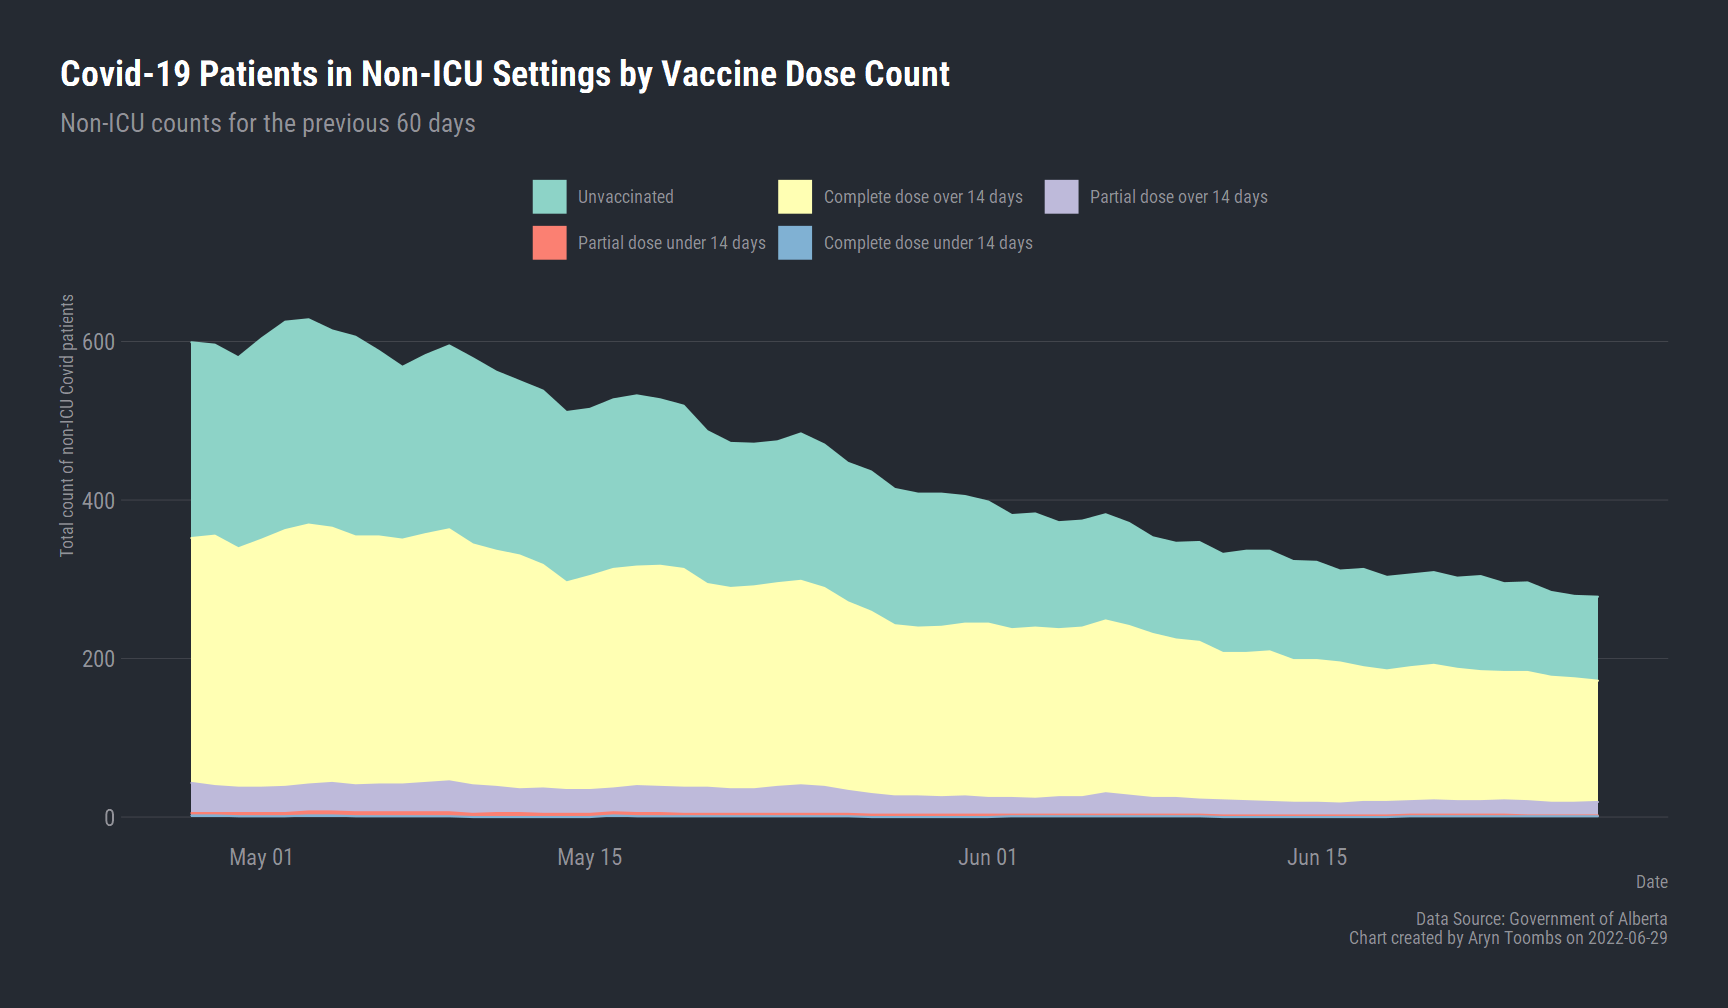
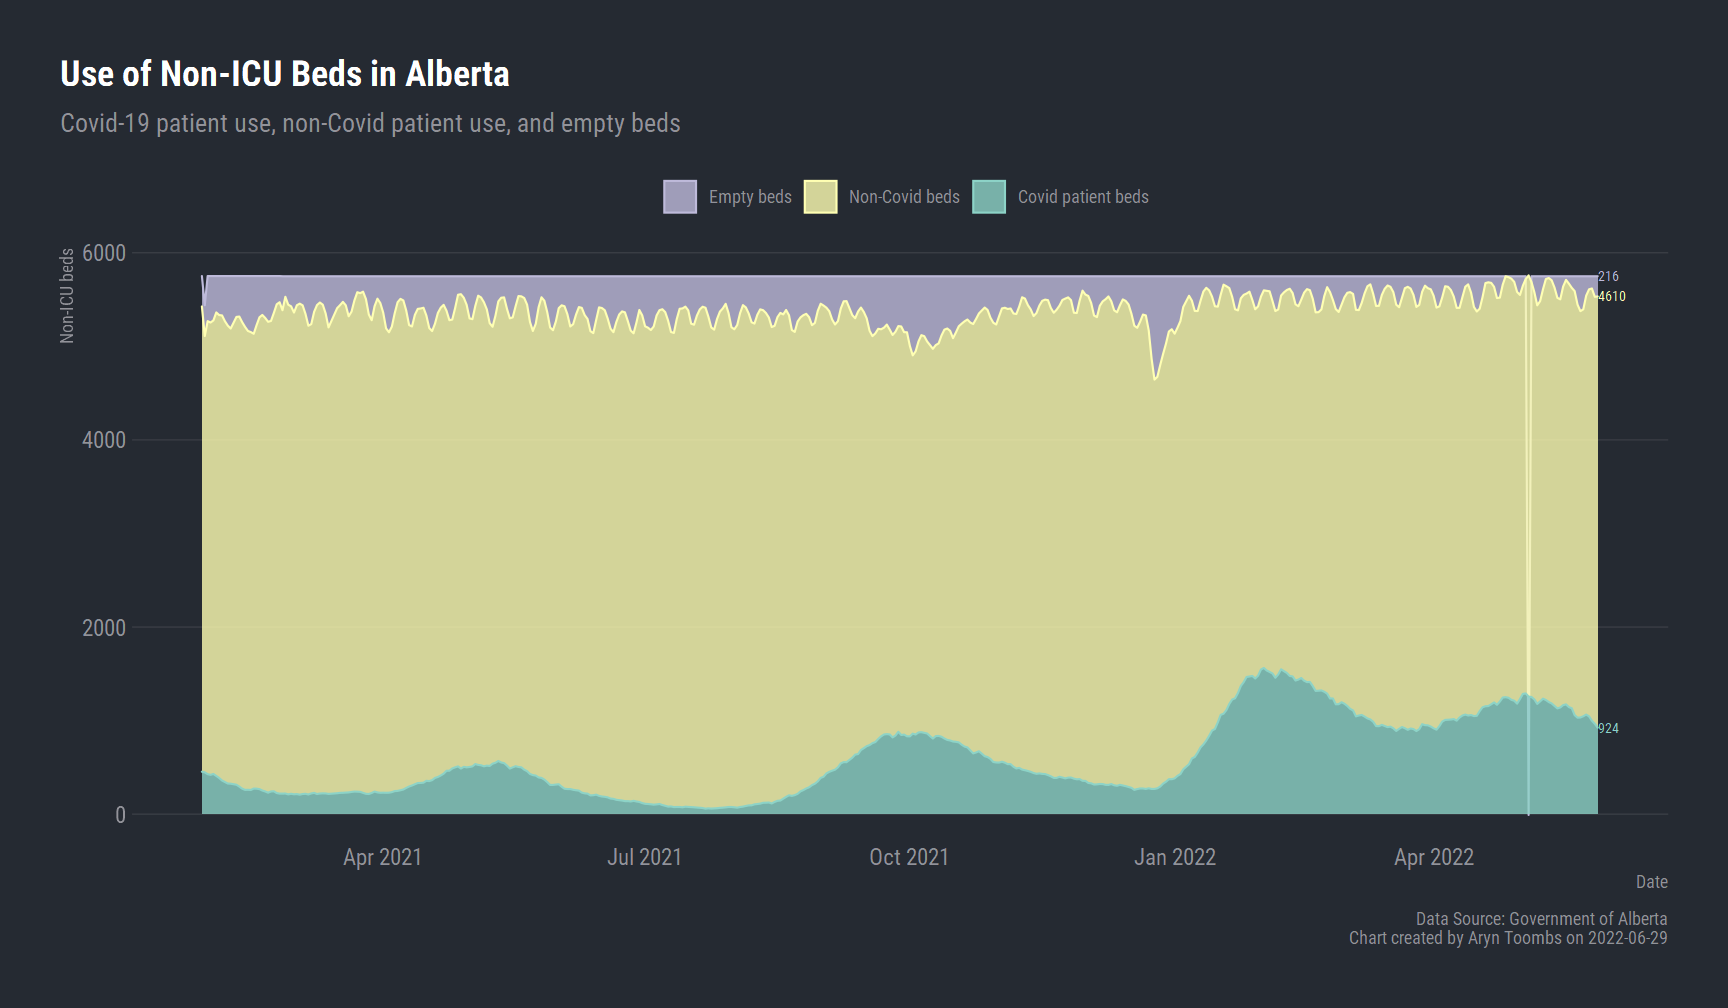
Hospitalization Admission Charts
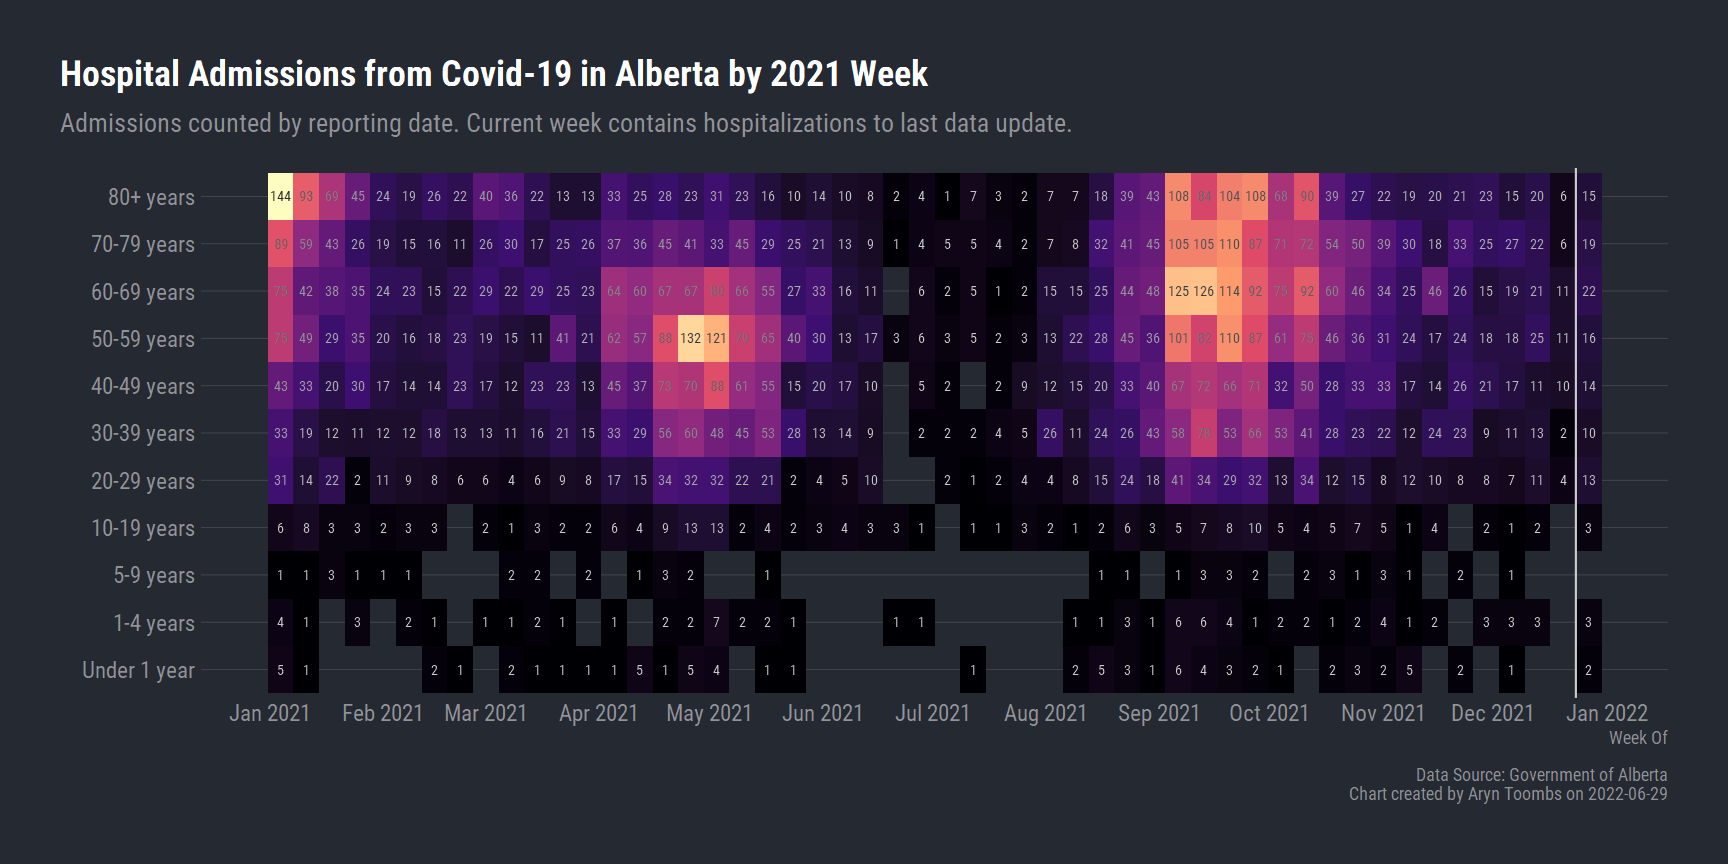
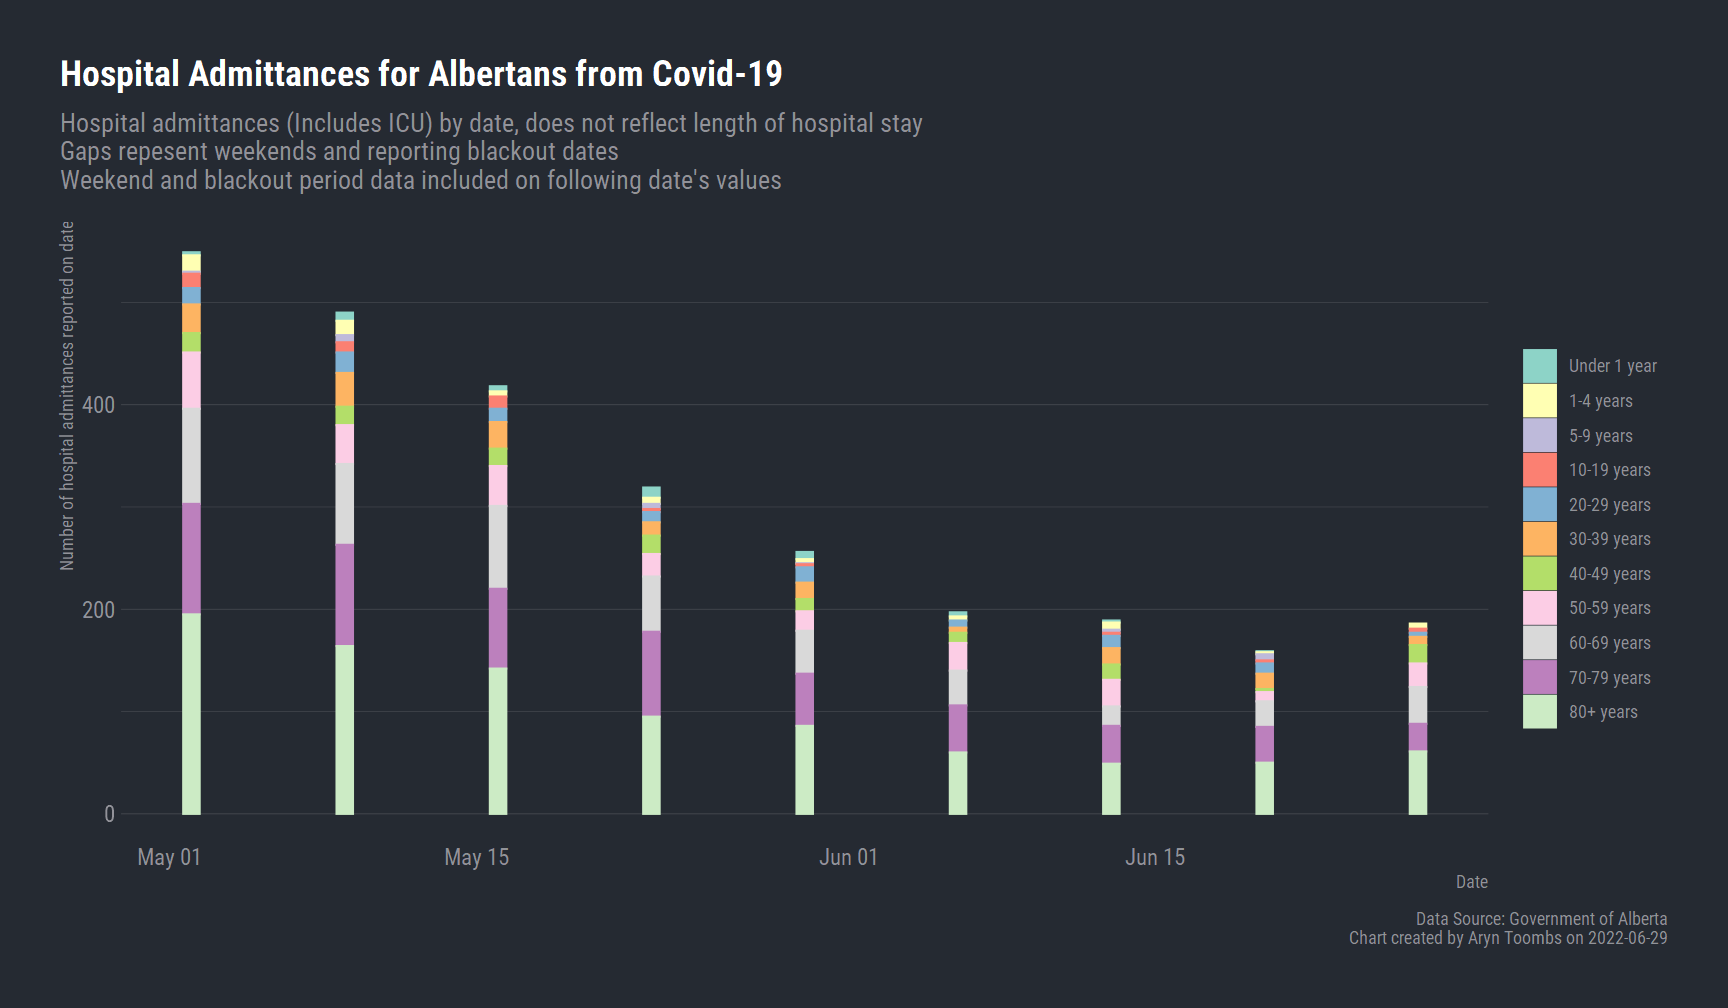
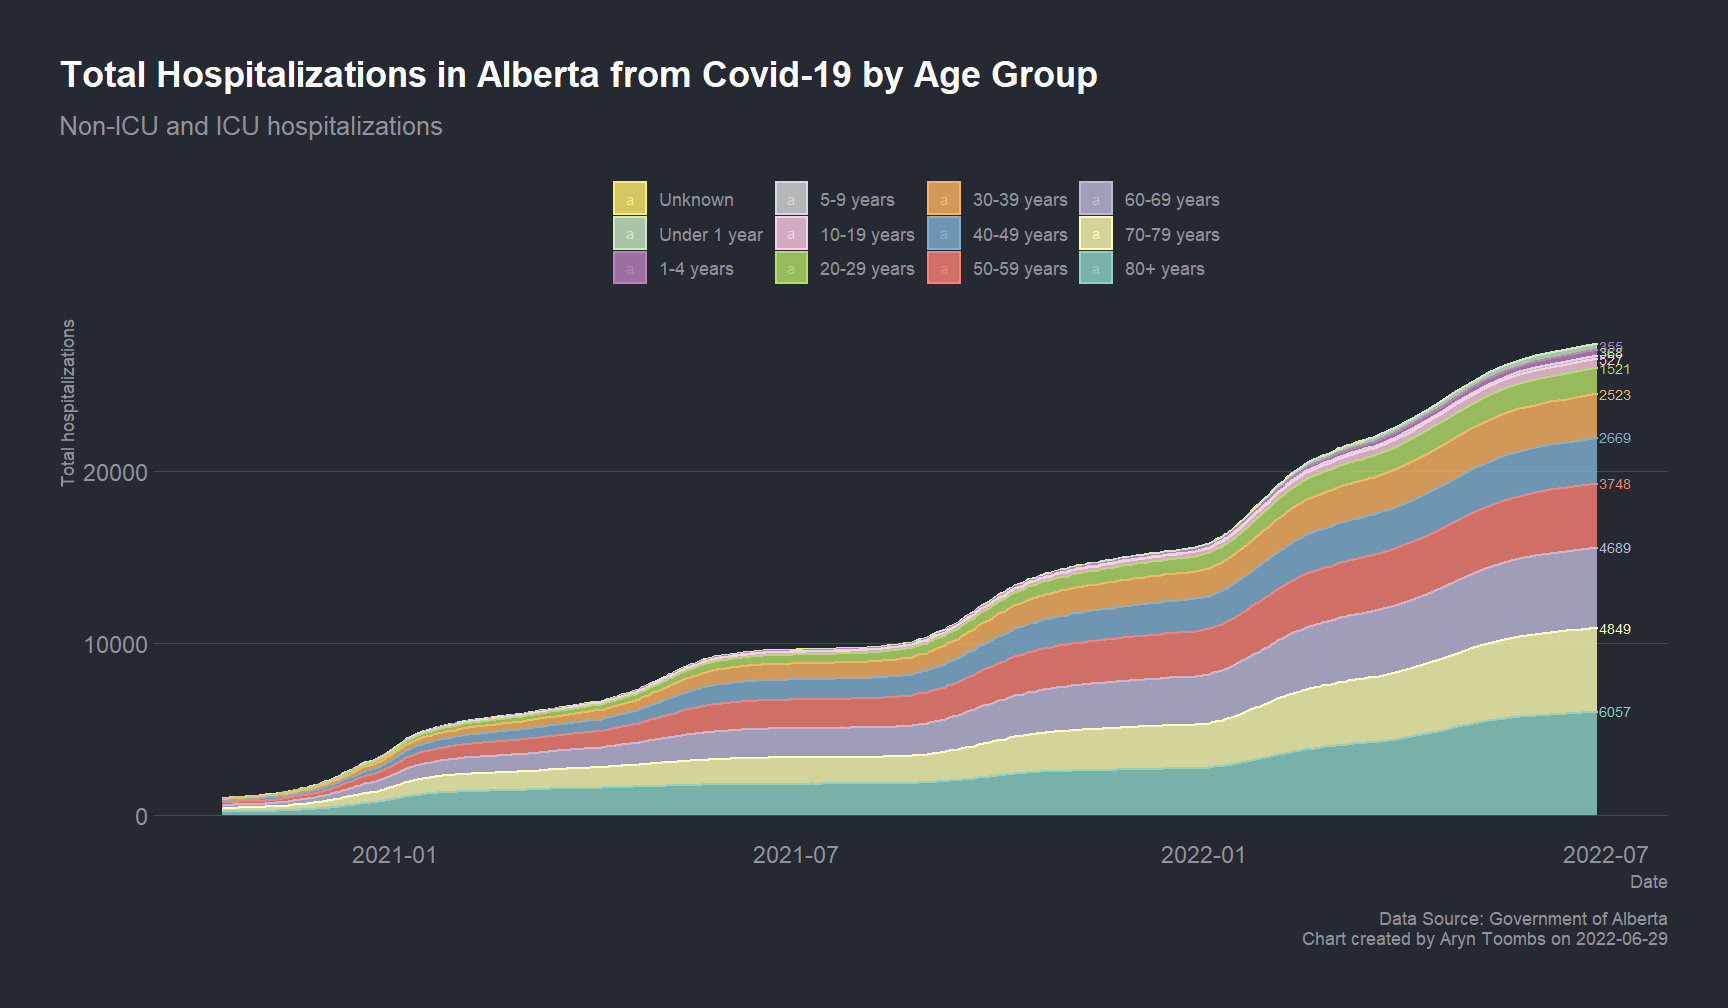
Severe Outcomes Tables
| Covid-19 Severe Outcomes by Date | |||||||
|---|---|---|---|---|---|---|---|
| Hospitalizations, ICU admissions, and deaths | |||||||
| Date | Age Group | Totals | Changes as of Date | ||||
| Hosp. | ICU | Deaths | New Hosp. | New ICU | New Deaths | ||
| 2022-06-27 | Total | 27488 | 4097 | 4621 | 185 | 18 | 17 |
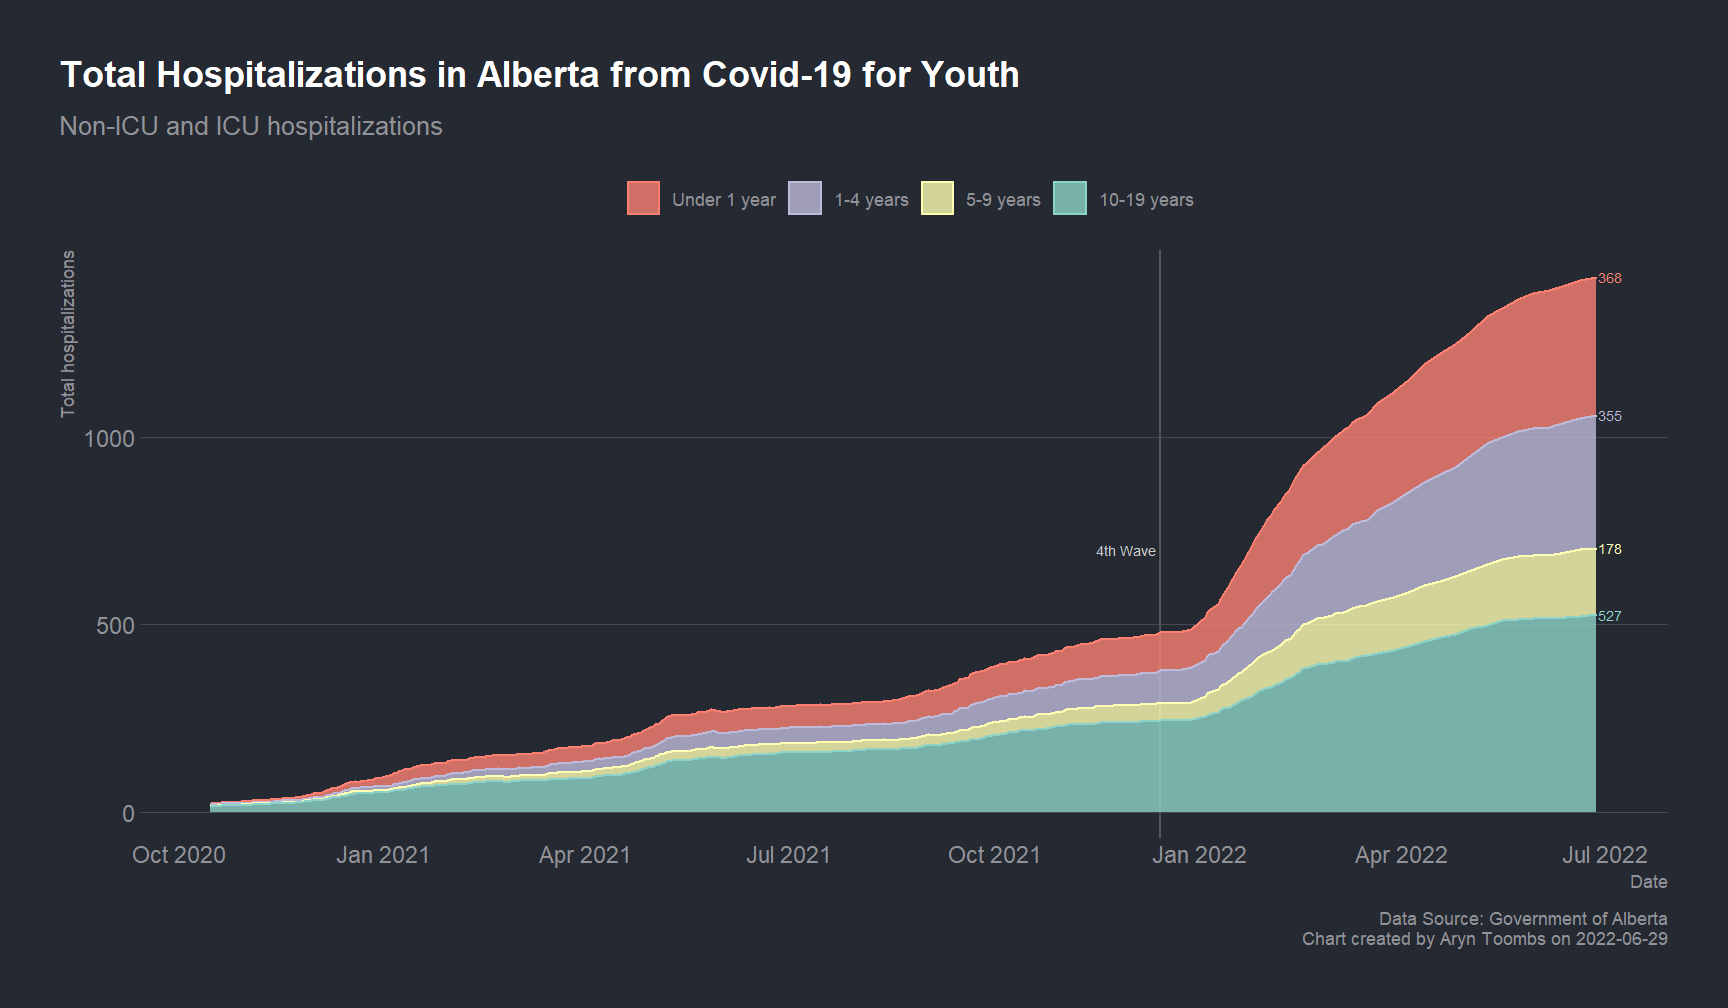
| 2022-06-27 | Under 1 year | 368 | 71 | 0 | 0 | 0 | 0 |
| 2022-06-27 | 1-4 years | 355 | 37 | 1 | 5 | 0 | 0 |
| 2022-06-27 | 5-9 years | 178 | 25 | 2 | 0 | 0 | 0 |
| 2022-06-27 | 10-19 years | 527 | 63 | 2 | 4 | 0 | 0 |
| 2022-06-27 | 20-29 years | 1521 | 159 | 19 | 4 | 0 | 0 |
| 2022-06-27 | 30-39 years | 2523 | 315 | 48 | 8 | 0 | 0 |
| 2022-06-27 | 40-49 years | 2669 | 536 | 106 | 18 | 4 | 0 |
| 2022-06-27 | 50-59 years | 3748 | 875 | 278 | 23 | 7 | 0 |
| 2022-06-27 | 60-69 years | 4689 | 1061 | 626 | 36 | 2 | 3 |
| 2022-06-27 | 70-79 years | 4849 | 740 | 1075 | 27 | 3 | 2 |
| 2022-06-27 | 80+ years | 6057 | 214 | 2463 | 61 | 2 | 12 |
| 2022-06-27 | Unknown | 4 | 1 | 1 | -1 | 0 | 0 |
| Data Source: Government of Alberta | |||||||
New ICU admissions are included in new hospital admissions counts.