VOC Charts: Alberta Health Services Zone Charts and Maps
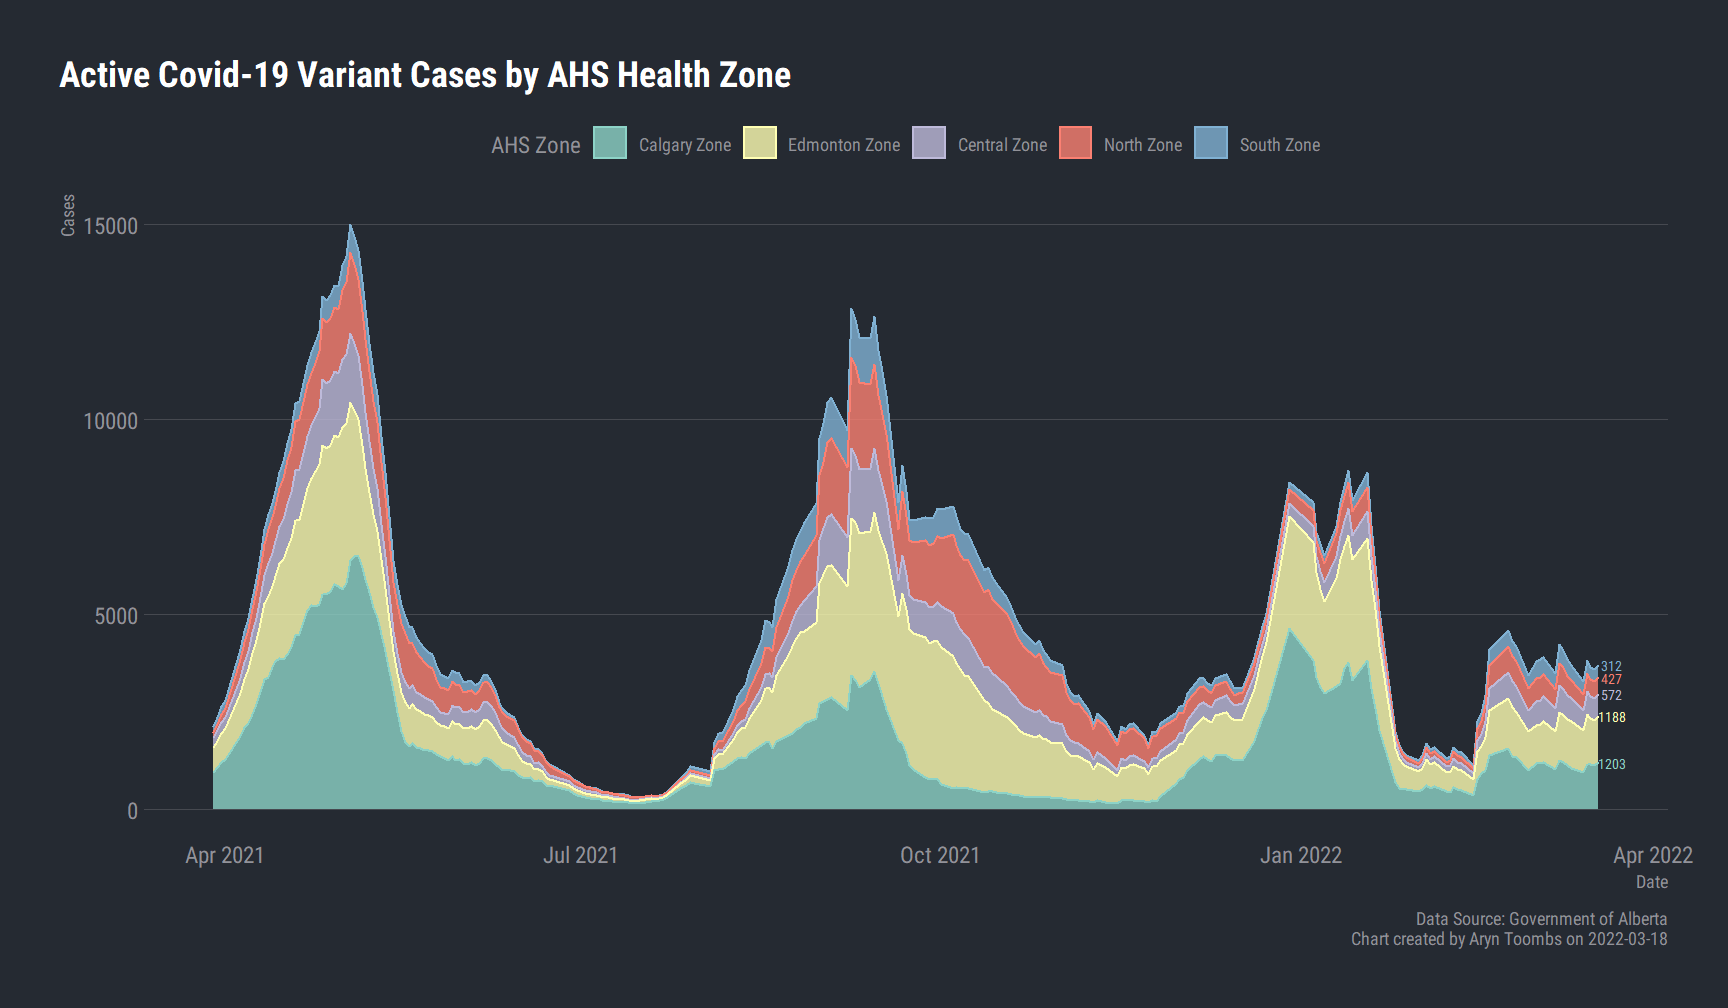
Alberta Health Services and the Government of Alberta Covid-19 tracker began providing active VOC cases by AHS Zone on Mar 29.
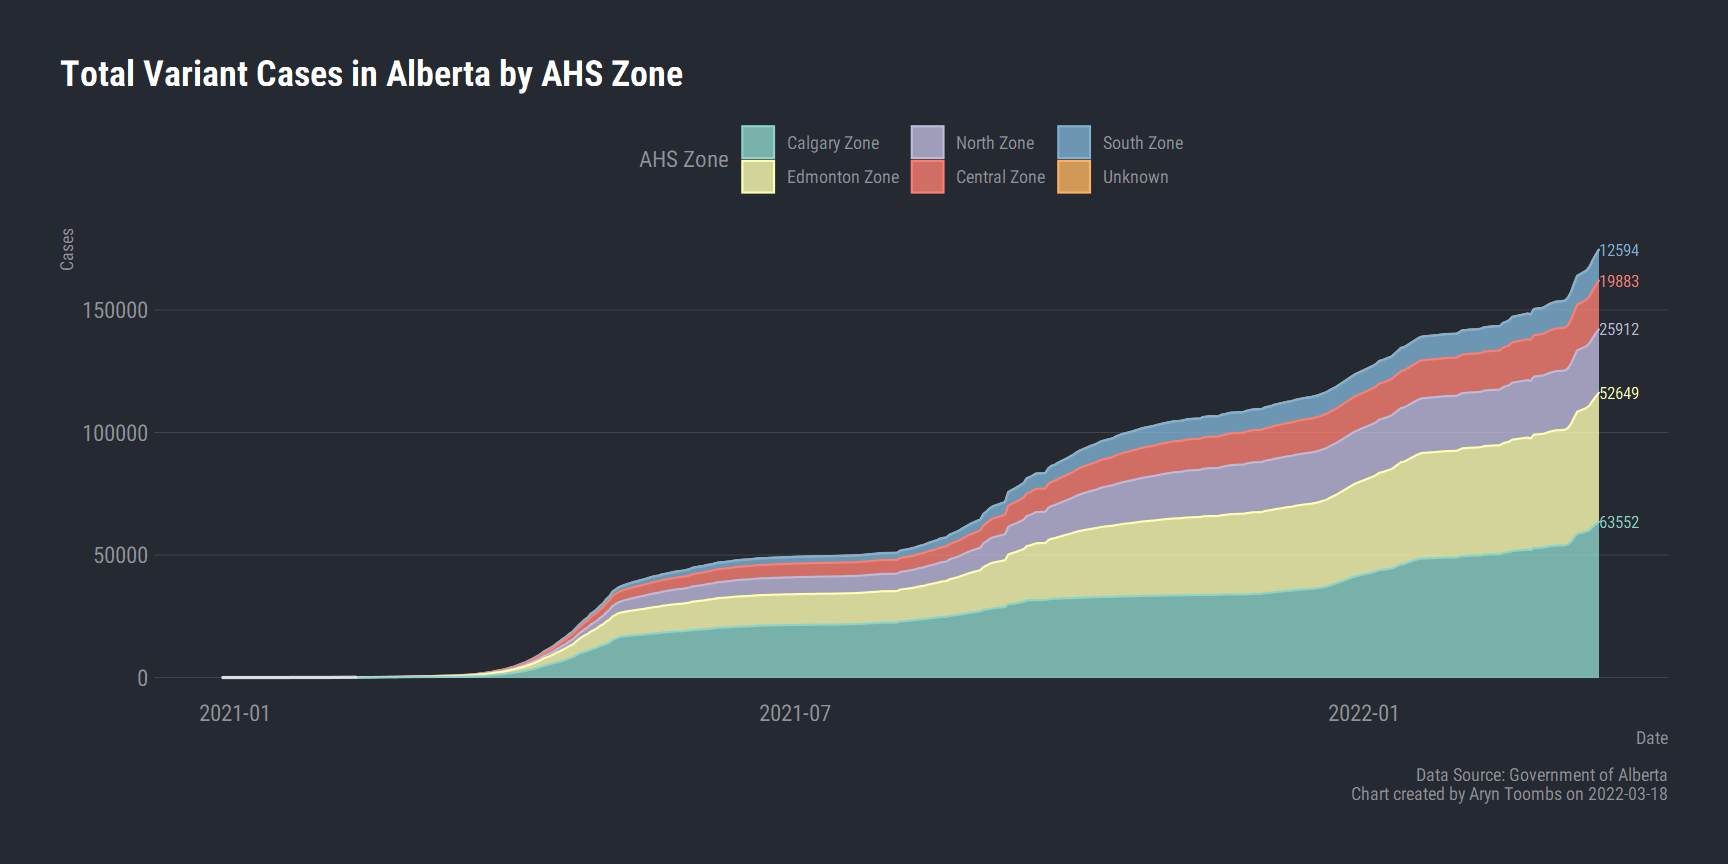
Charts reflect total values reported on indicated dates. Decreases in values reflect adjusted counts by AHS.
VOC Charts: Daily and Cumulative Charts
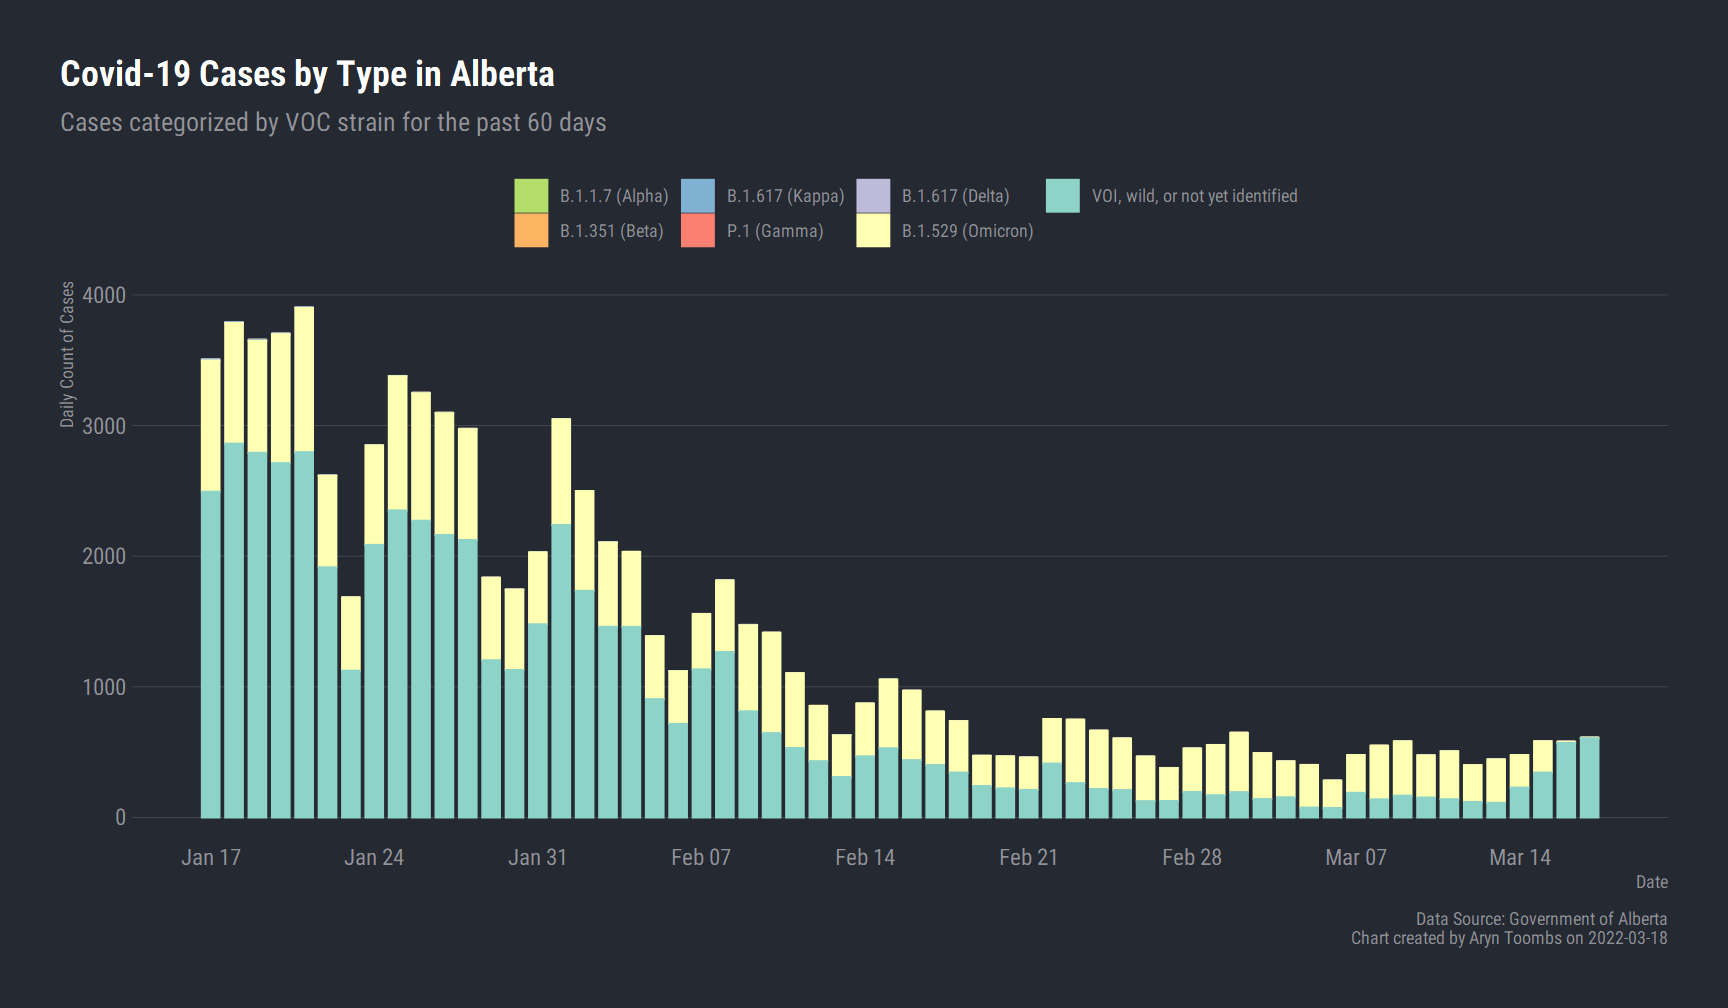
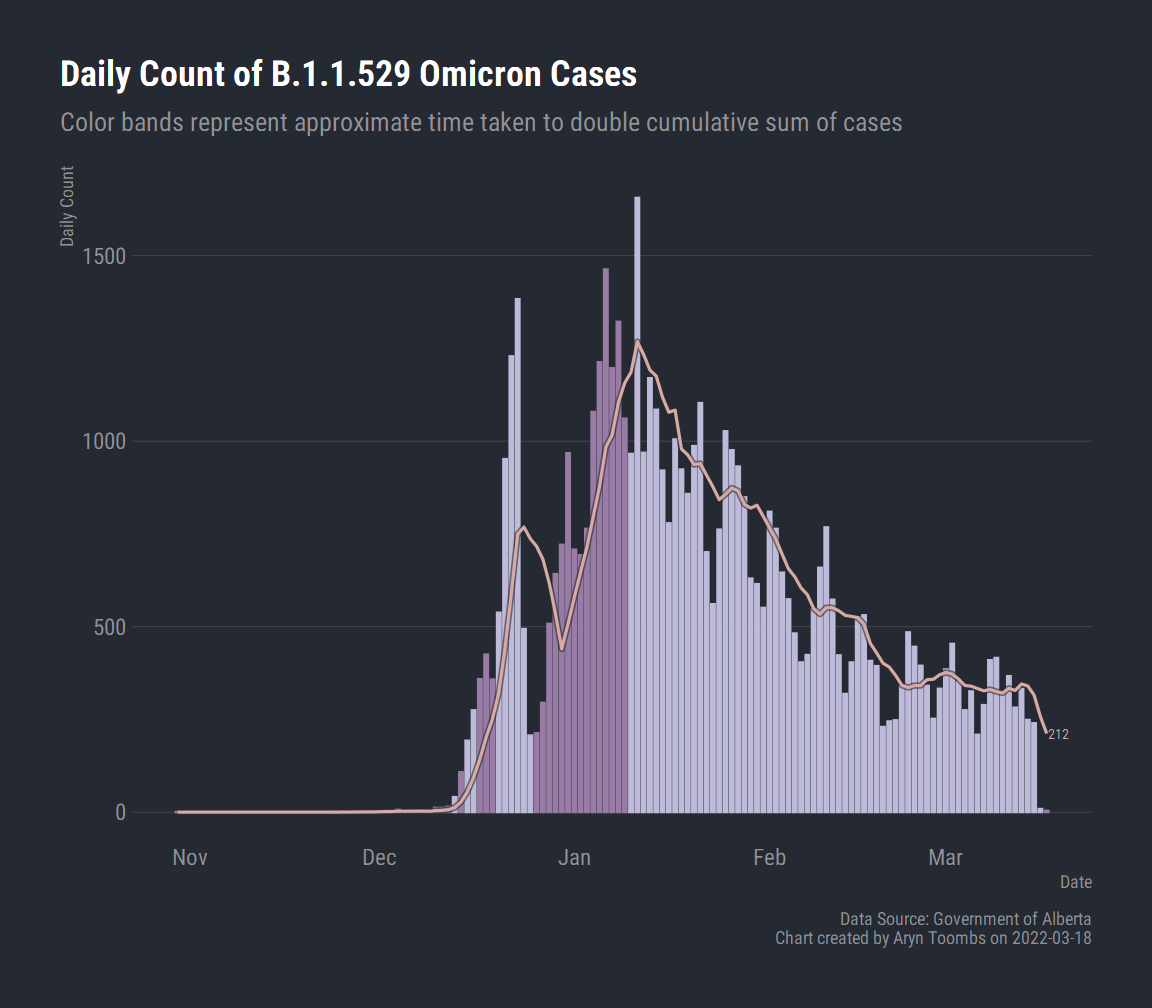
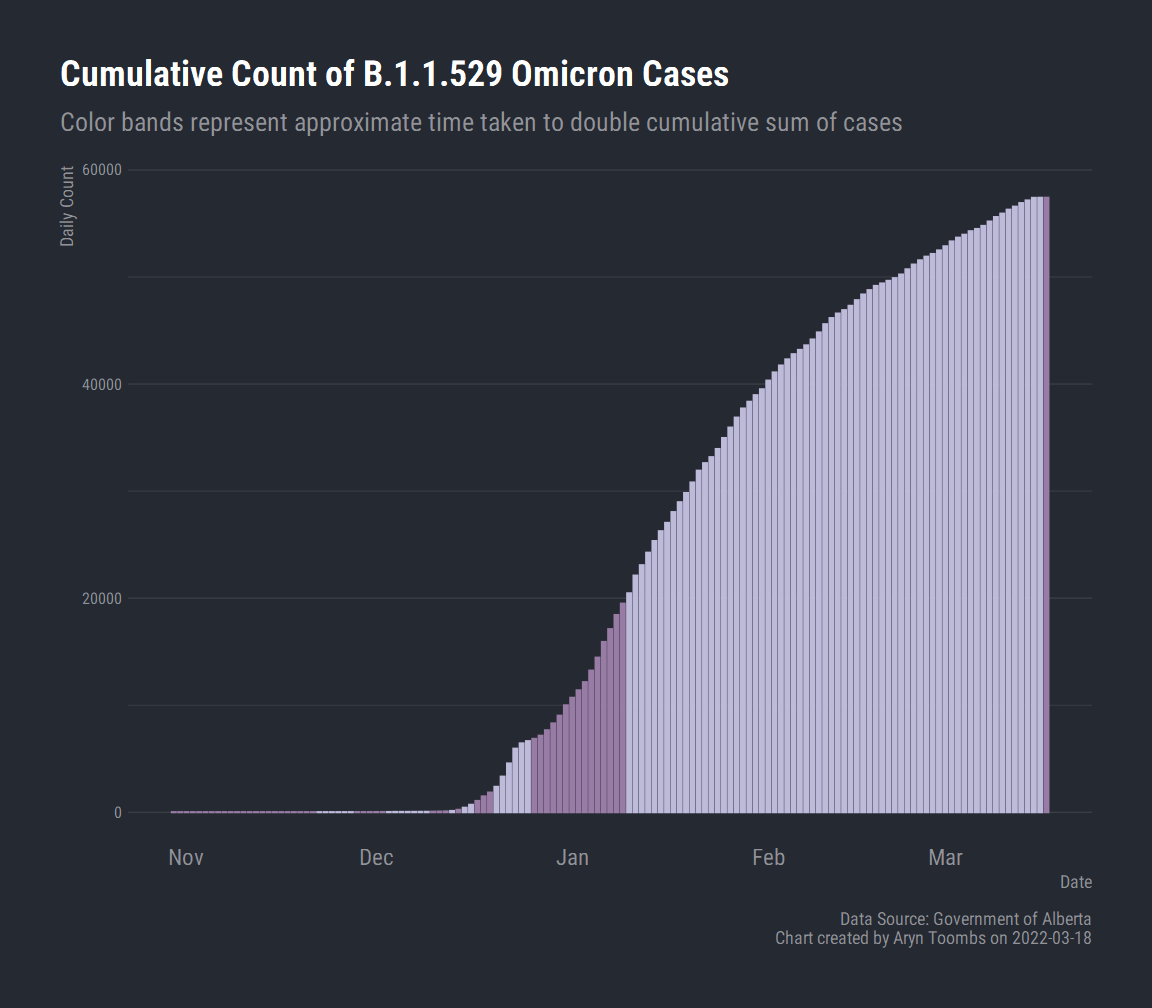
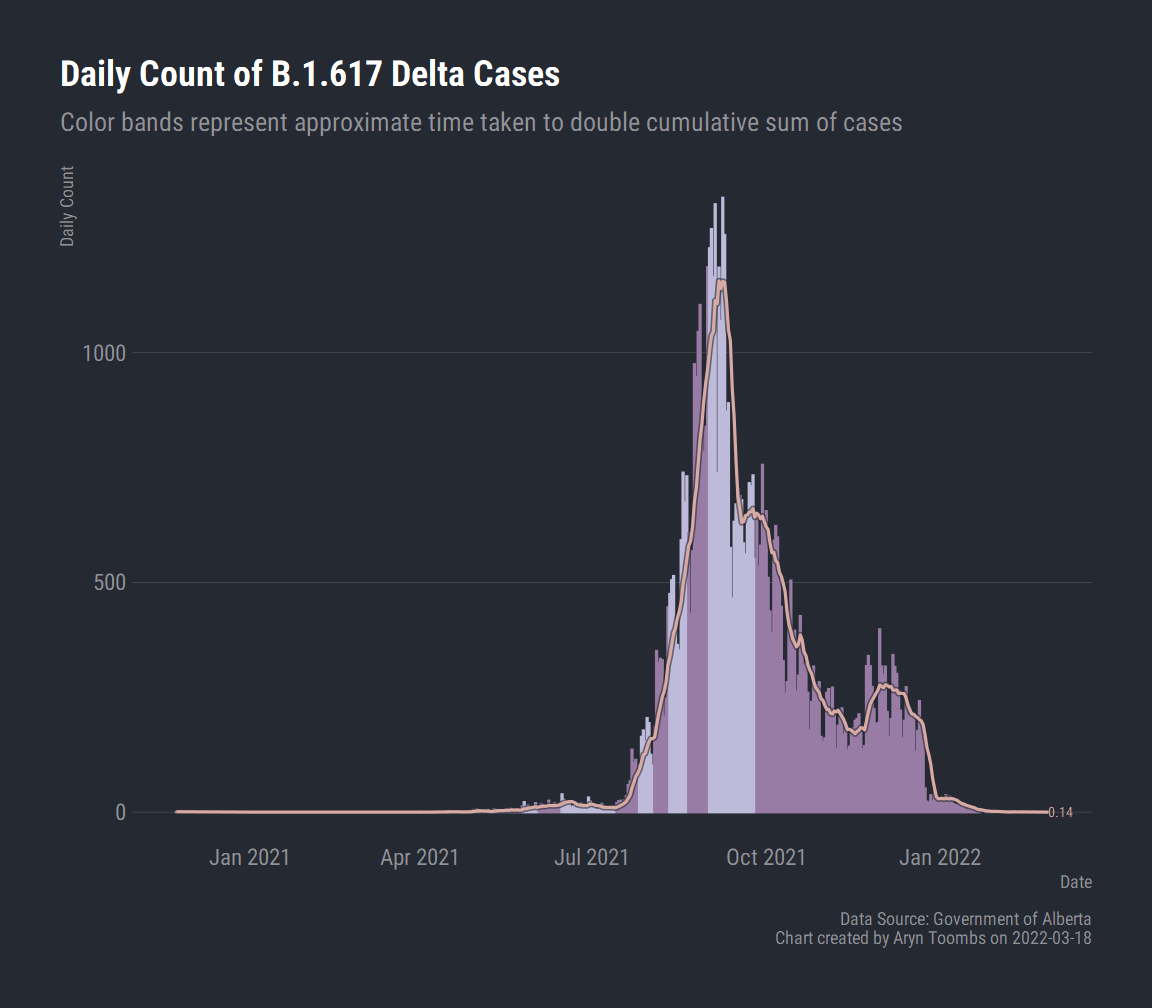
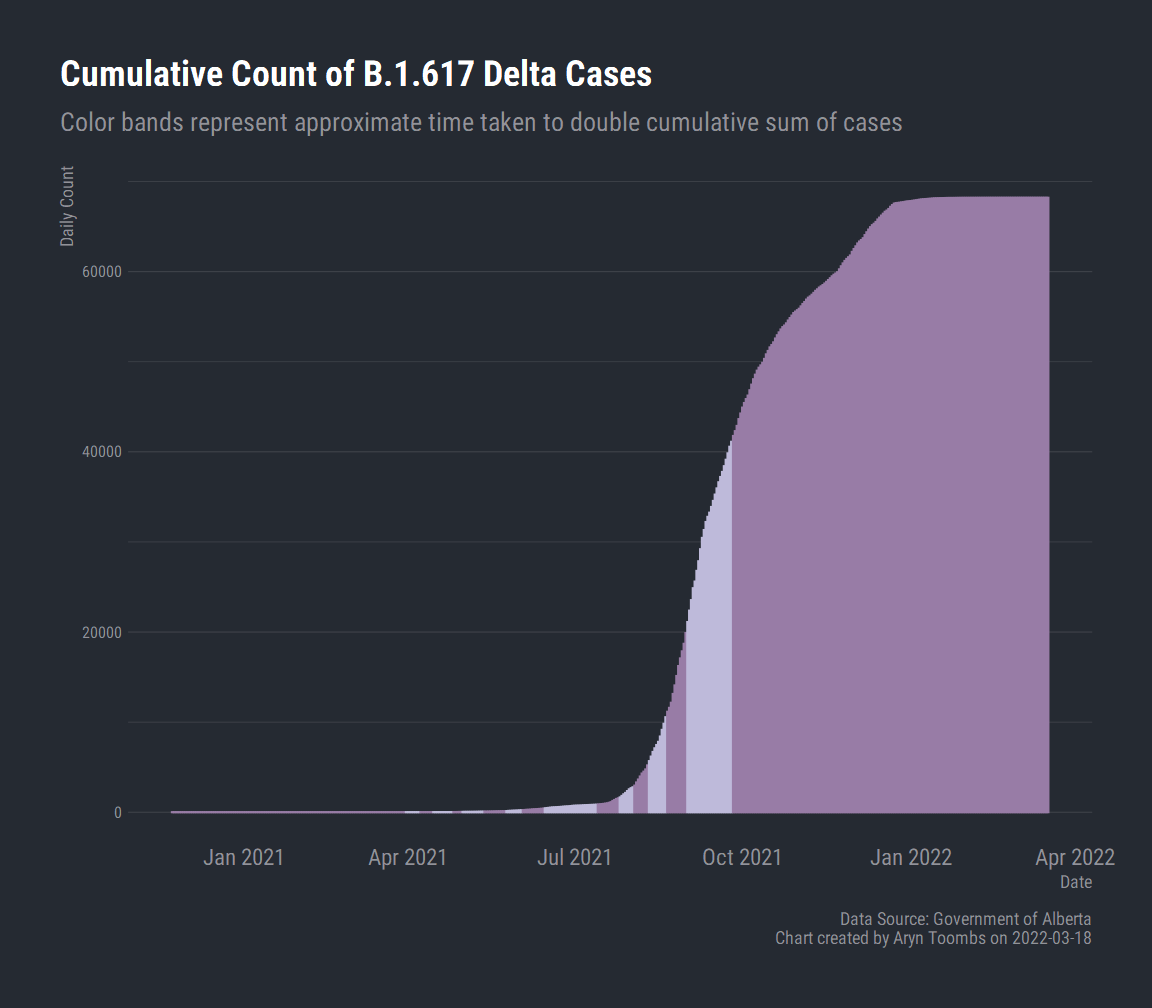
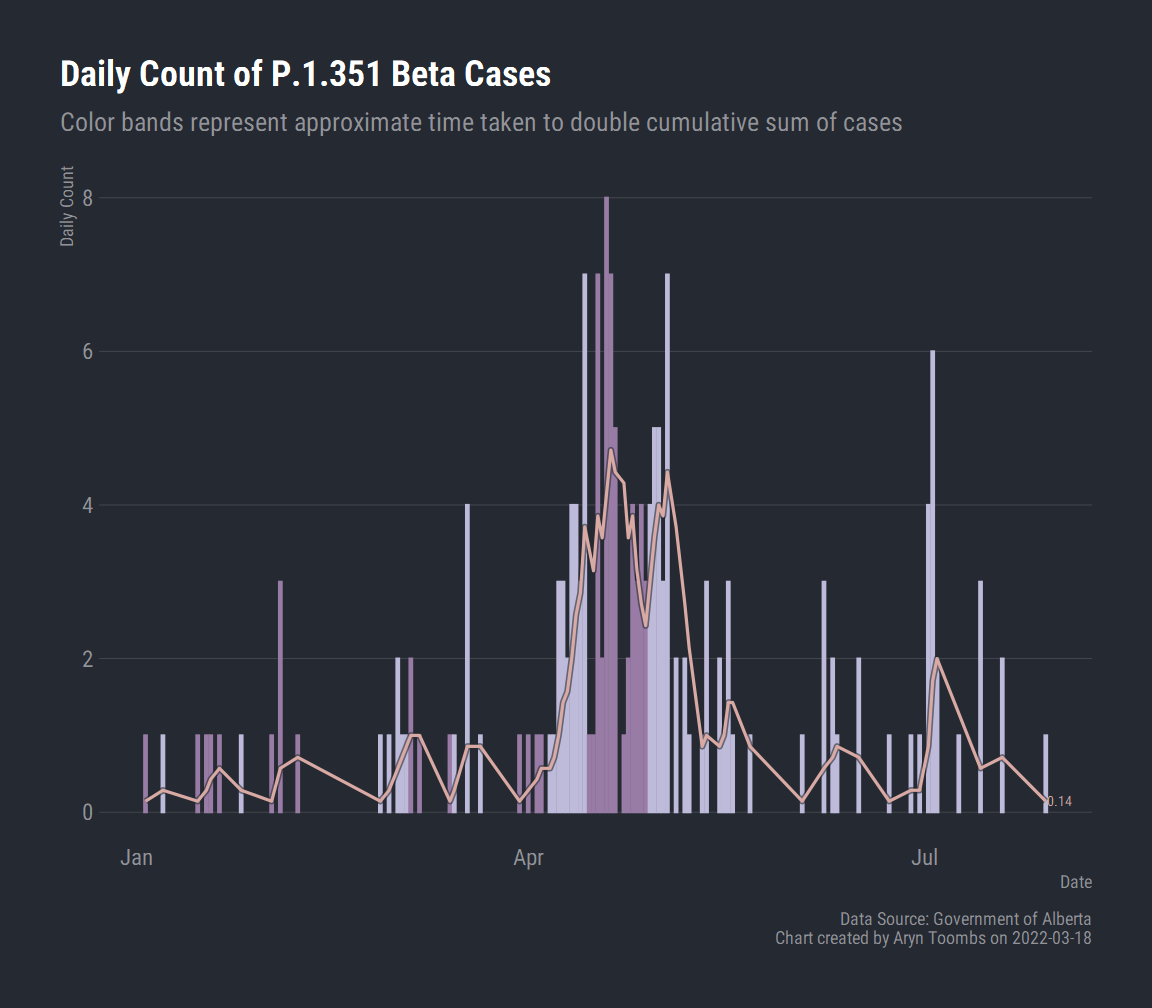
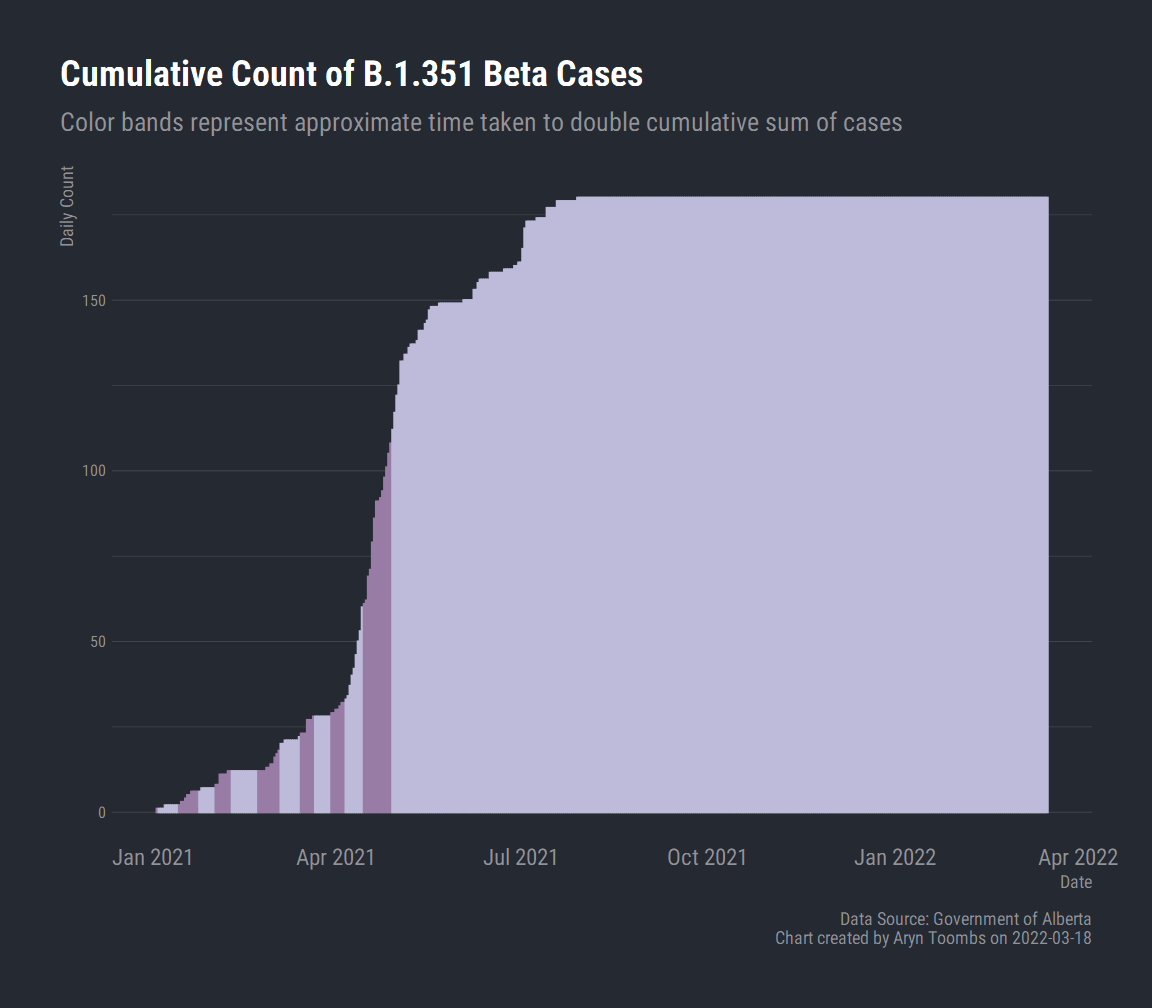
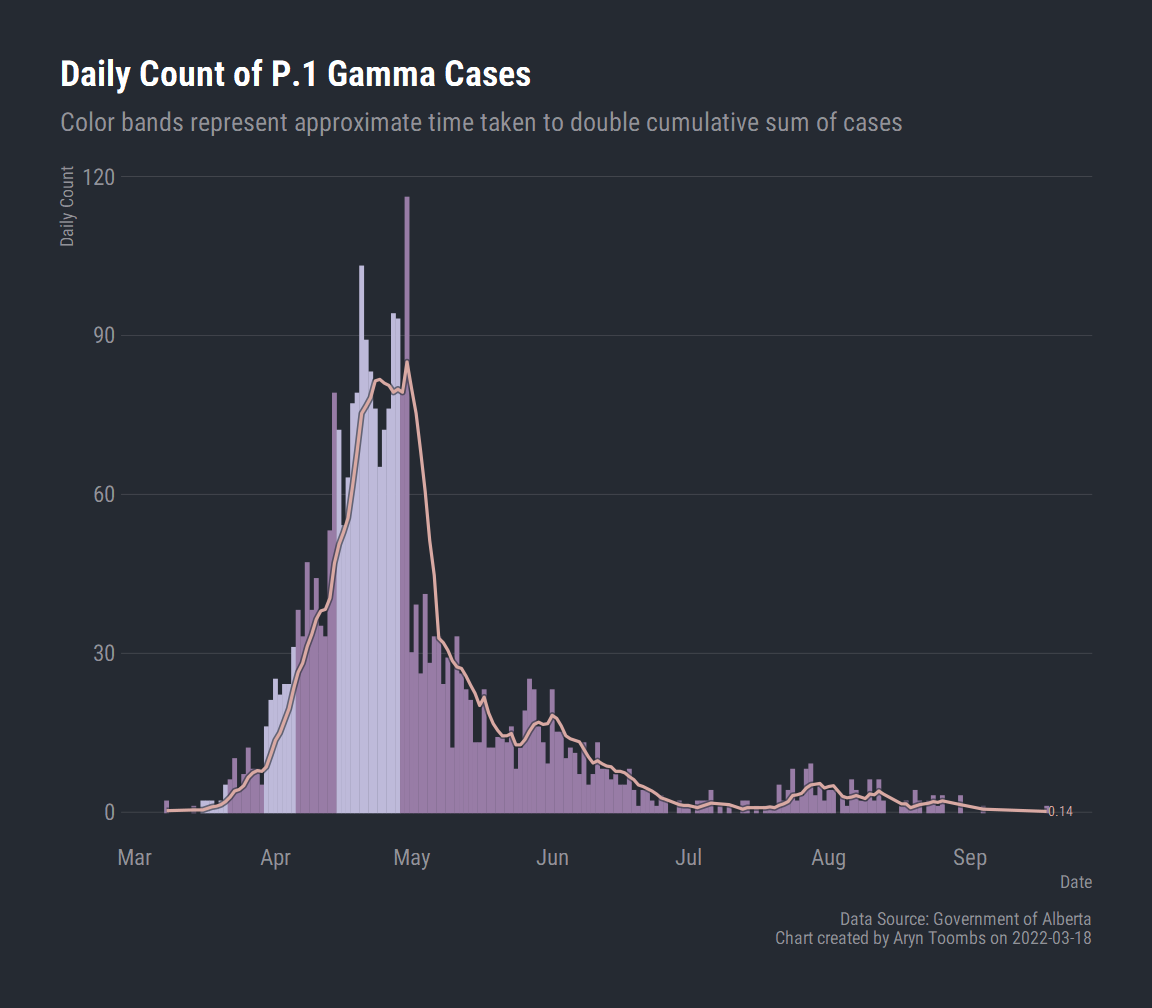
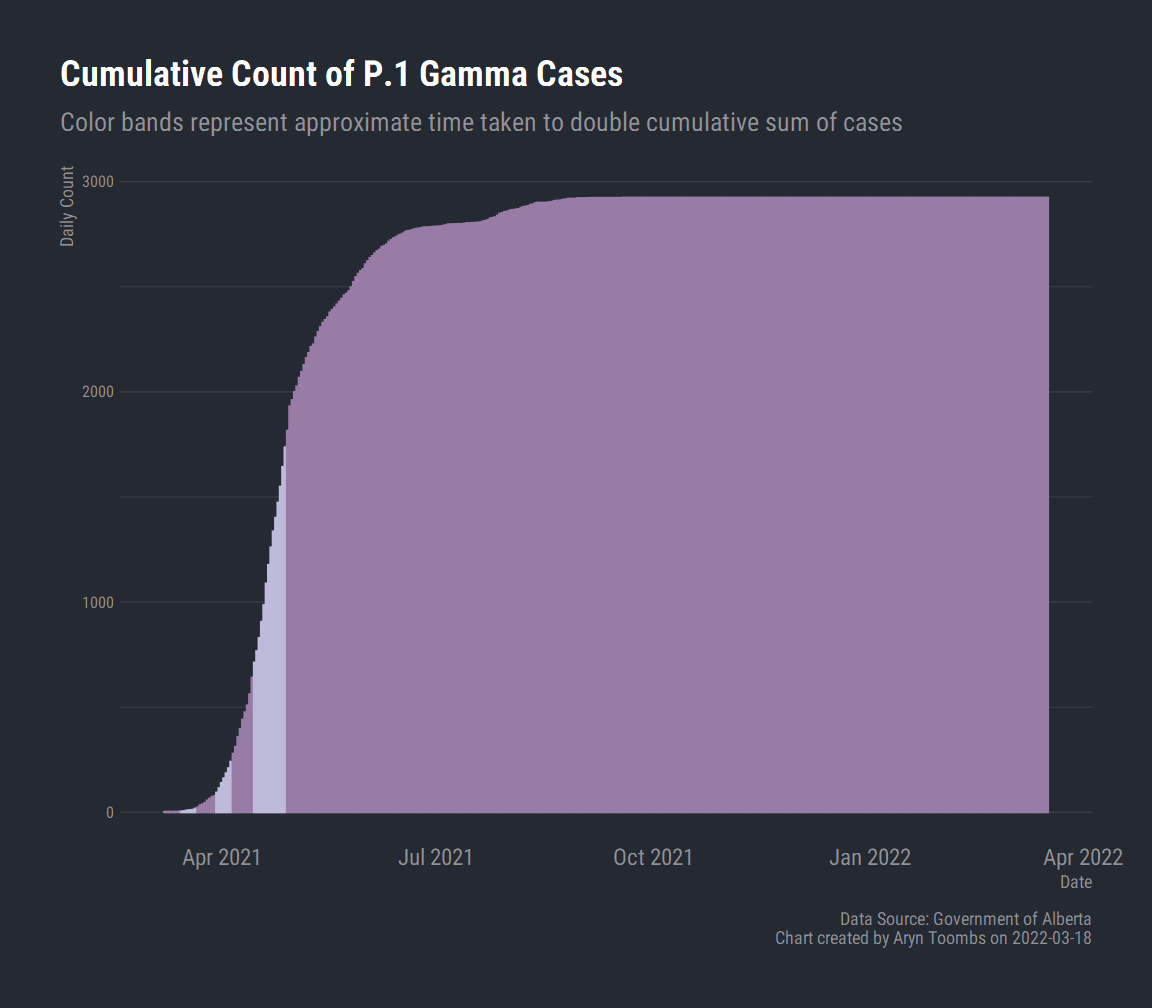
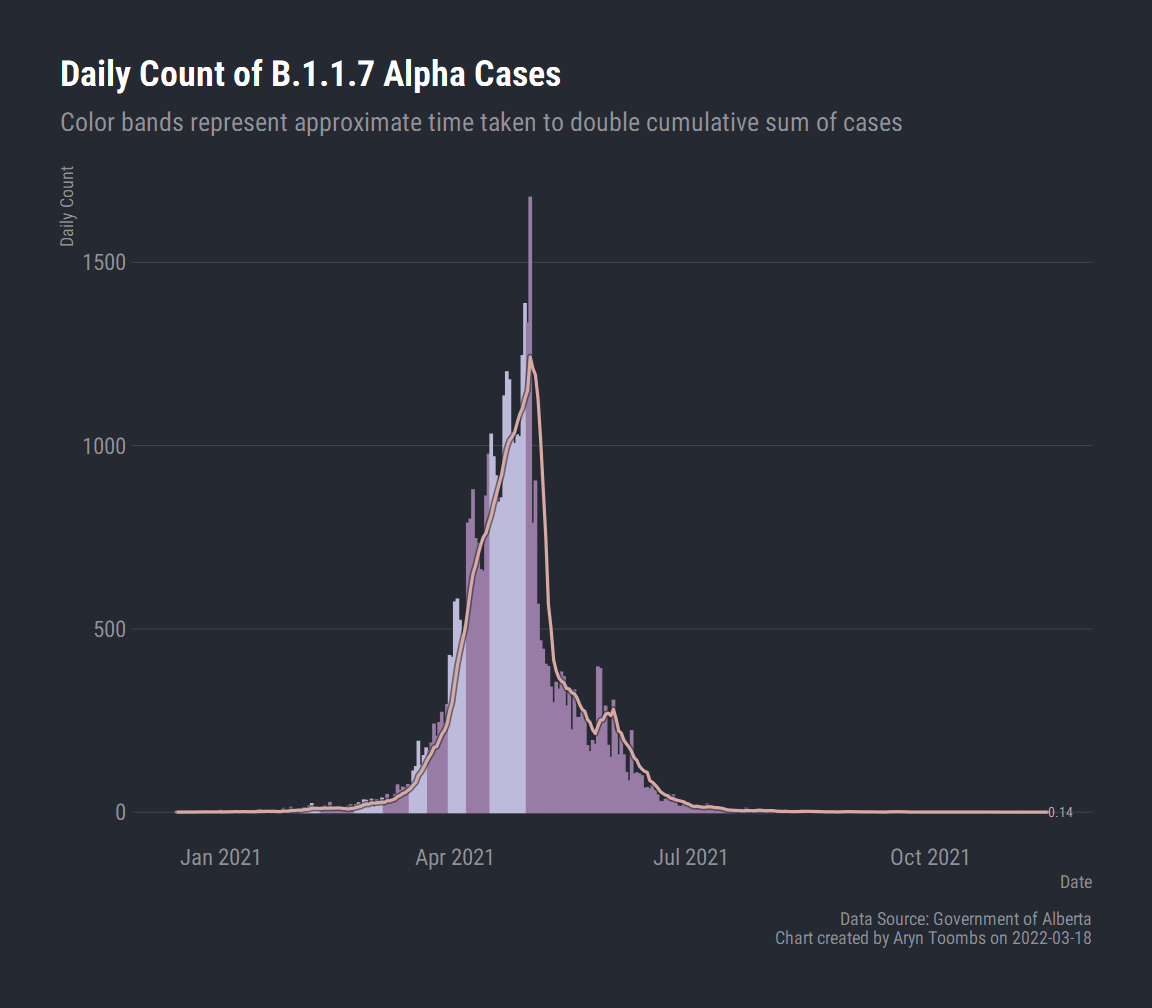
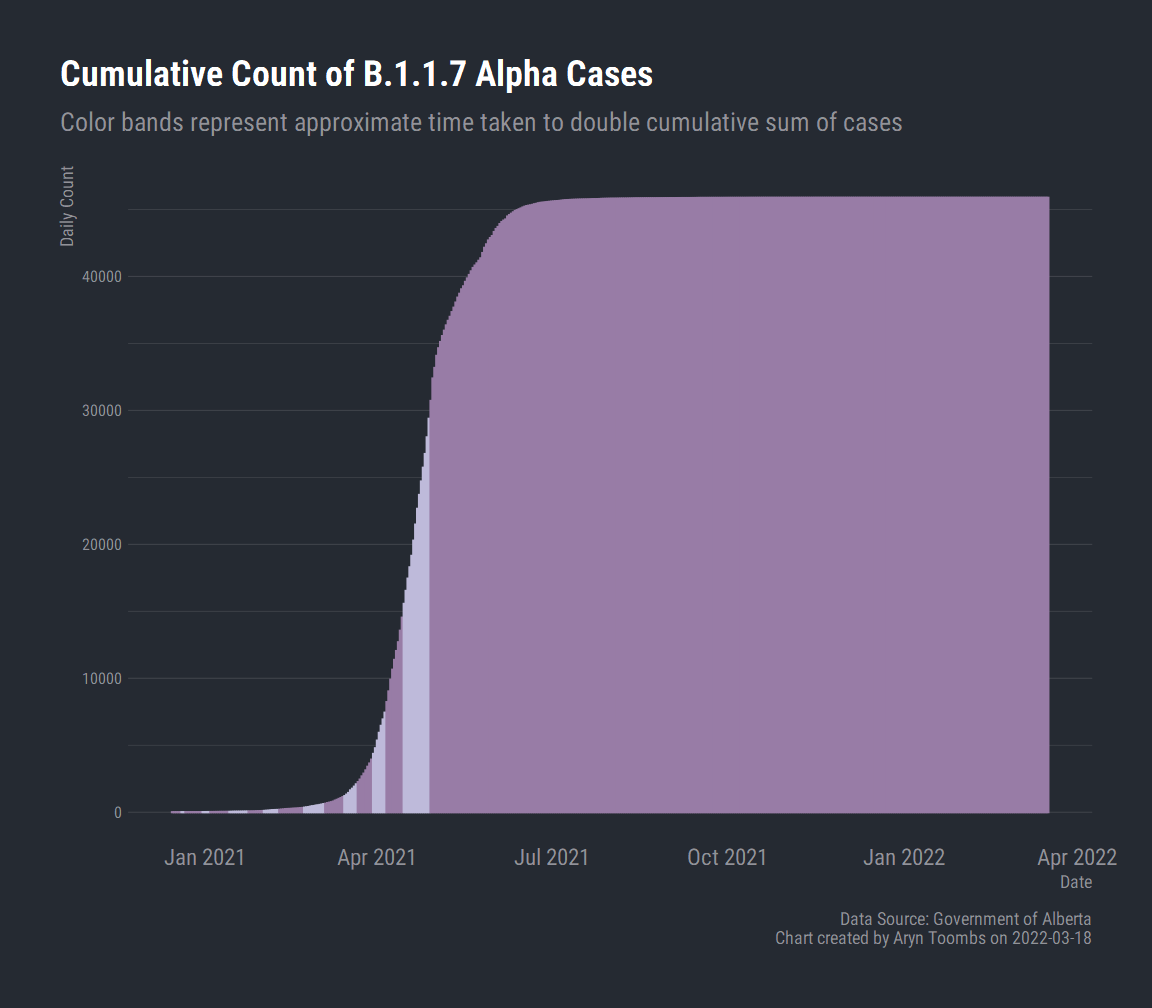
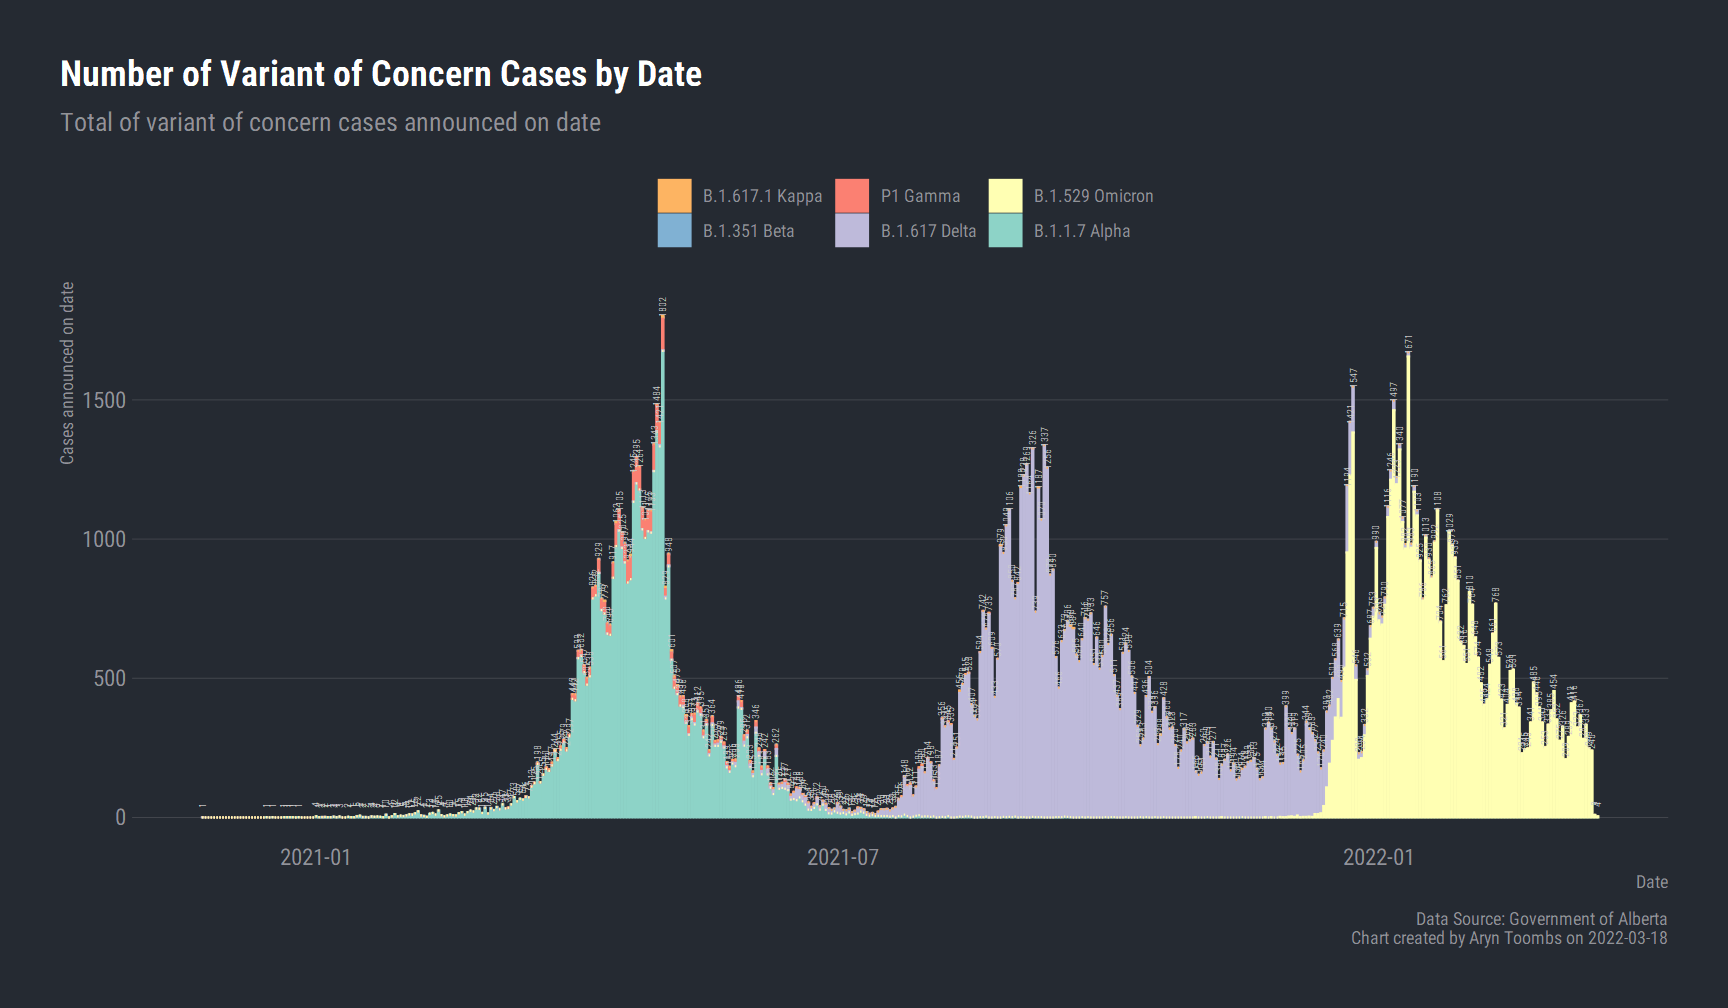
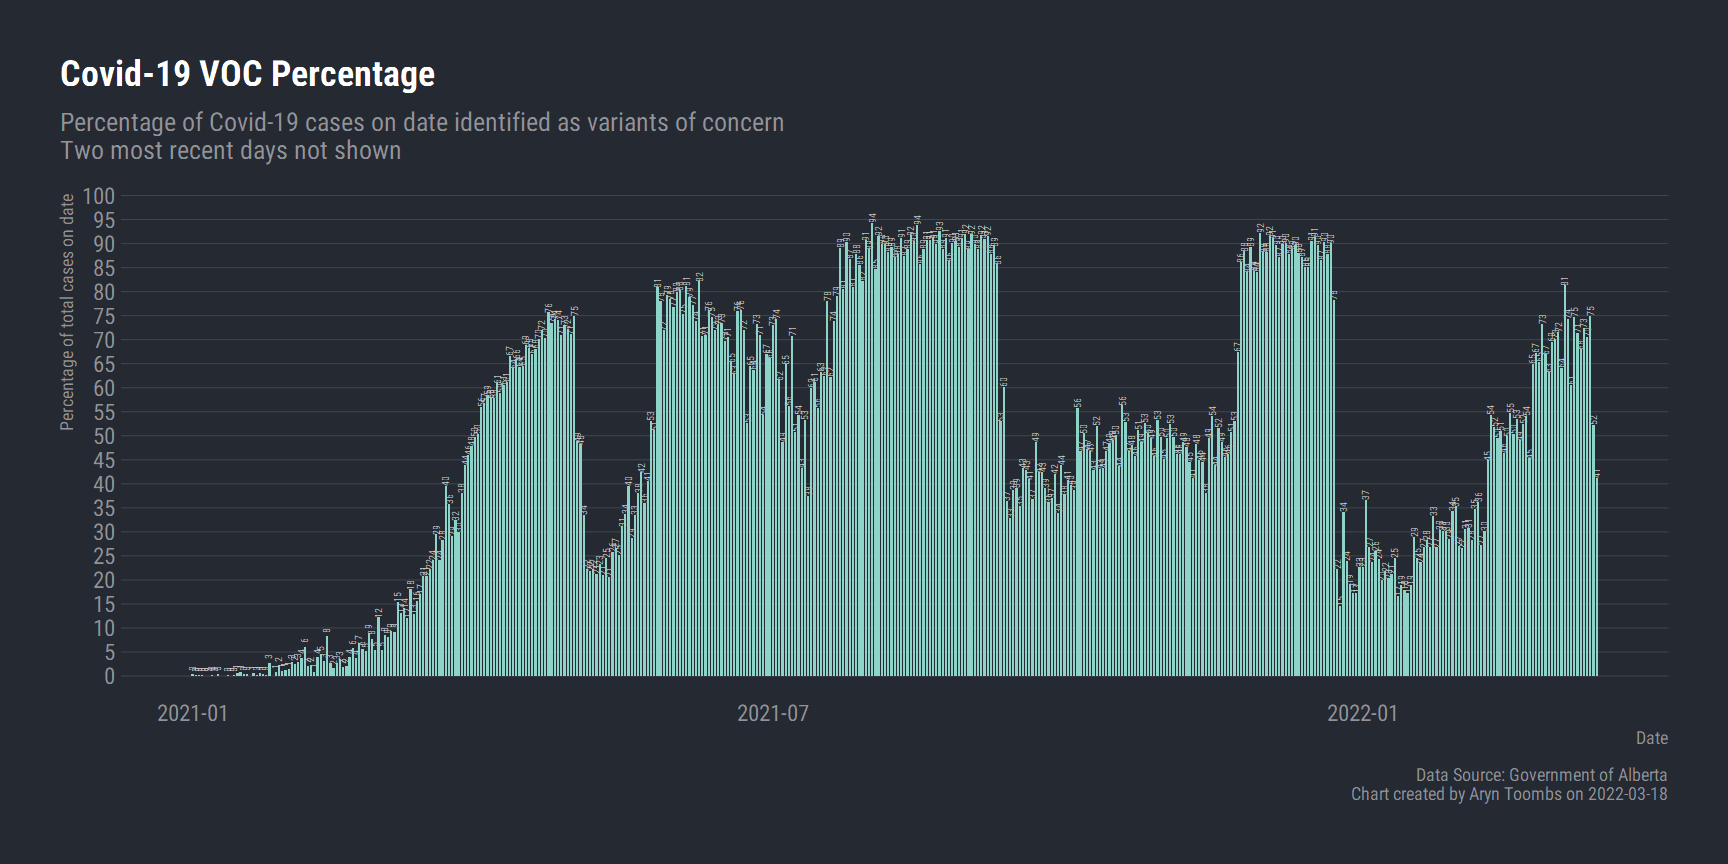
The two most current days are not shown on the chart as the delay in identifying VOC cases takes approximately two days.